ClickHouse는 쿼리를 매우 빠르게 처리하지만, 이러한 쿼리는
어떻게 여러 서버에 분산되어 병렬로 처리될까요?
이 가이드에서는 먼저 ClickHouse가 분산 테이블을 통해 쿼리를 여러 세그먼트로
분산하는 방식과, 쿼리 실행 시 여러 레플리카를 활용하는 방식을 살펴봅니다.
세그먼트 아키텍처
shared-nothing 아키텍처에서는 클러스터를 일반적으로 여러 세그먼트로
분할하며, 각 세그먼트는 전체 데이터의 일부(subset)를 포함합니다.
분산 테이블은 이러한 세그먼트 위에 위치하여 전체 데이터에 대한 통합 뷰를 제공합니다.
읽기 요청은 로컬 테이블로 보낼 수 있습니다. 이 경우 쿼리 실행은 지정된 세그먼트에서만
수행됩니다. 또는 분산 테이블로 보낼 수도 있으며, 이 경우 각 세그먼트가 주어진
쿼리를 실행합니다. 분산 테이블에 쿼리를 보낸 서버는 데이터를 집계하여 클라이언트에
응답합니다:
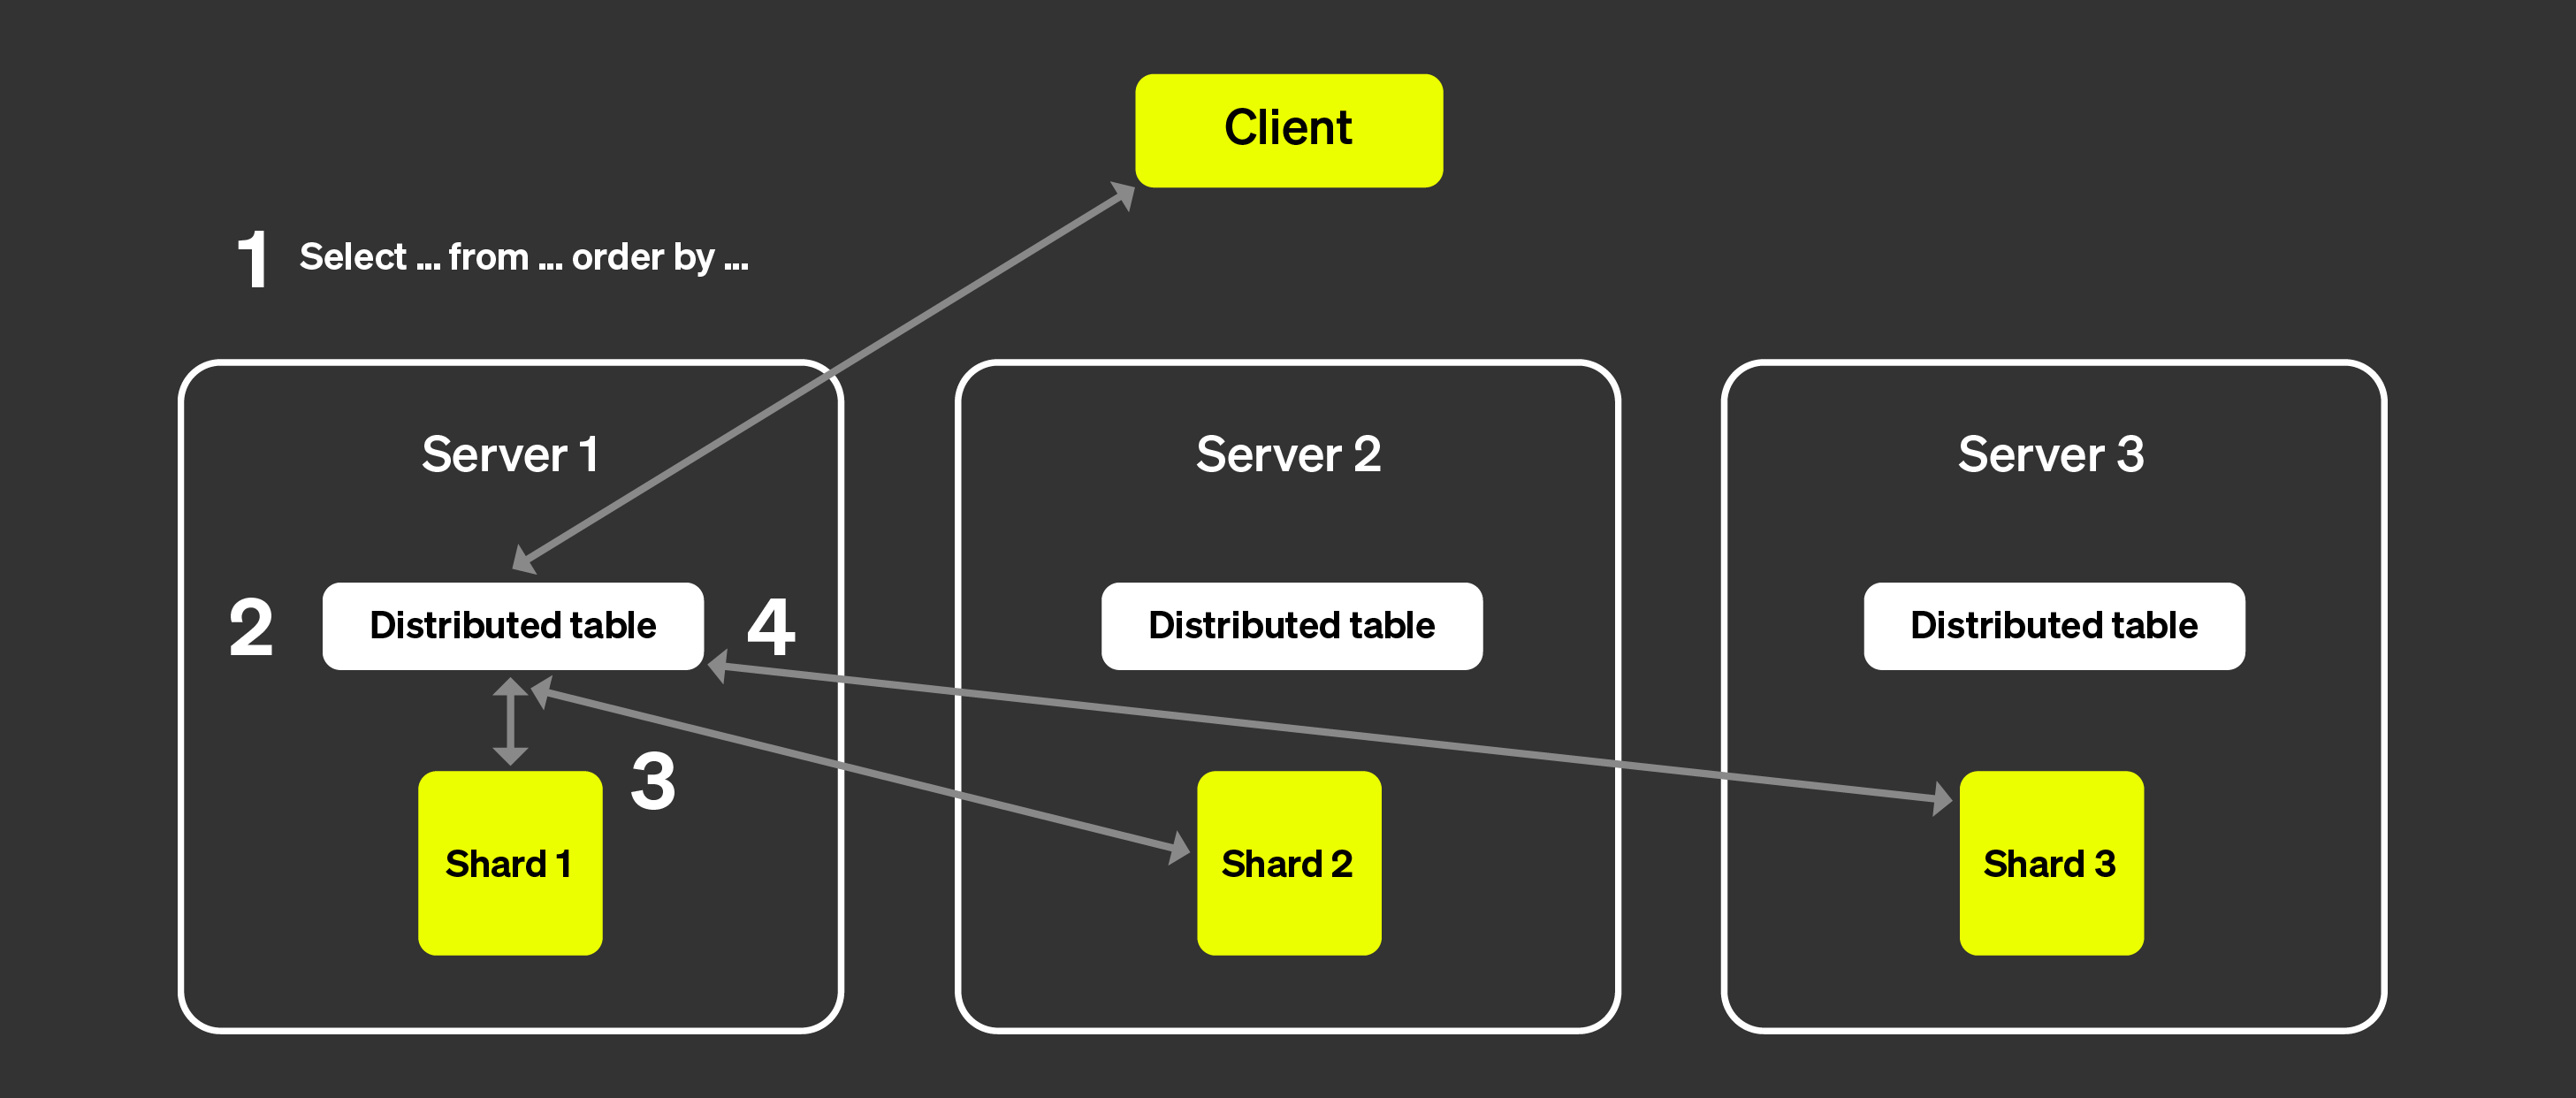
위 그림은 클라이언트가 분산 테이블에 쿼리를 보냈을 때 어떤 일이 발생하는지 시각화한 것입니다:
SELECT 쿼리는 임의의 노드의 분산 테이블로 전송됩니다
(라운드로빈 전략을 사용하거나 로드 밸런서에 의해 특정 서버로 라우팅된 후).
이 노드는 이제 코디네이터 역할을 수행합니다.
노드는 분산 테이블에 지정된 정보를 통해 쿼리를 실행해야 하는 각 세그먼트를
찾고, 각 세그먼트로 쿼리를 전송합니다.
각 세그먼트는 데이터를 로컬에서 읽고, 필터링하고, 집계한 뒤
병합 가능한 상태를 코디네이터로 다시 전송합니다.
코디네이터 노드는 데이터를 병합한 다음 응답을 클라이언트에 다시 전송합니다.
여기에 레플리카를 추가해도 프로세스는 거의 동일하며,
차이는 각 세그먼트에서 단 하나의 레플리카만 쿼리를 실행한다는 점입니다.
이는 더 많은 쿼리를 병렬로 처리할 수 있음을 의미합니다.
Non-sharded architecture
ClickHouse Cloud는 위에서 소개한 아키텍처와는 매우 다른 아키텍처를 사용합니다.
자세한 내용은 "ClickHouse Cloud Architecture"를
참고하십시오. 컴퓨트와 스토리지가 분리되어 있고, 사실상 무한에 가까운
스토리지를 사용할 수 있으므로 세그먼트의 필요성은 크게 줄어듭니다.
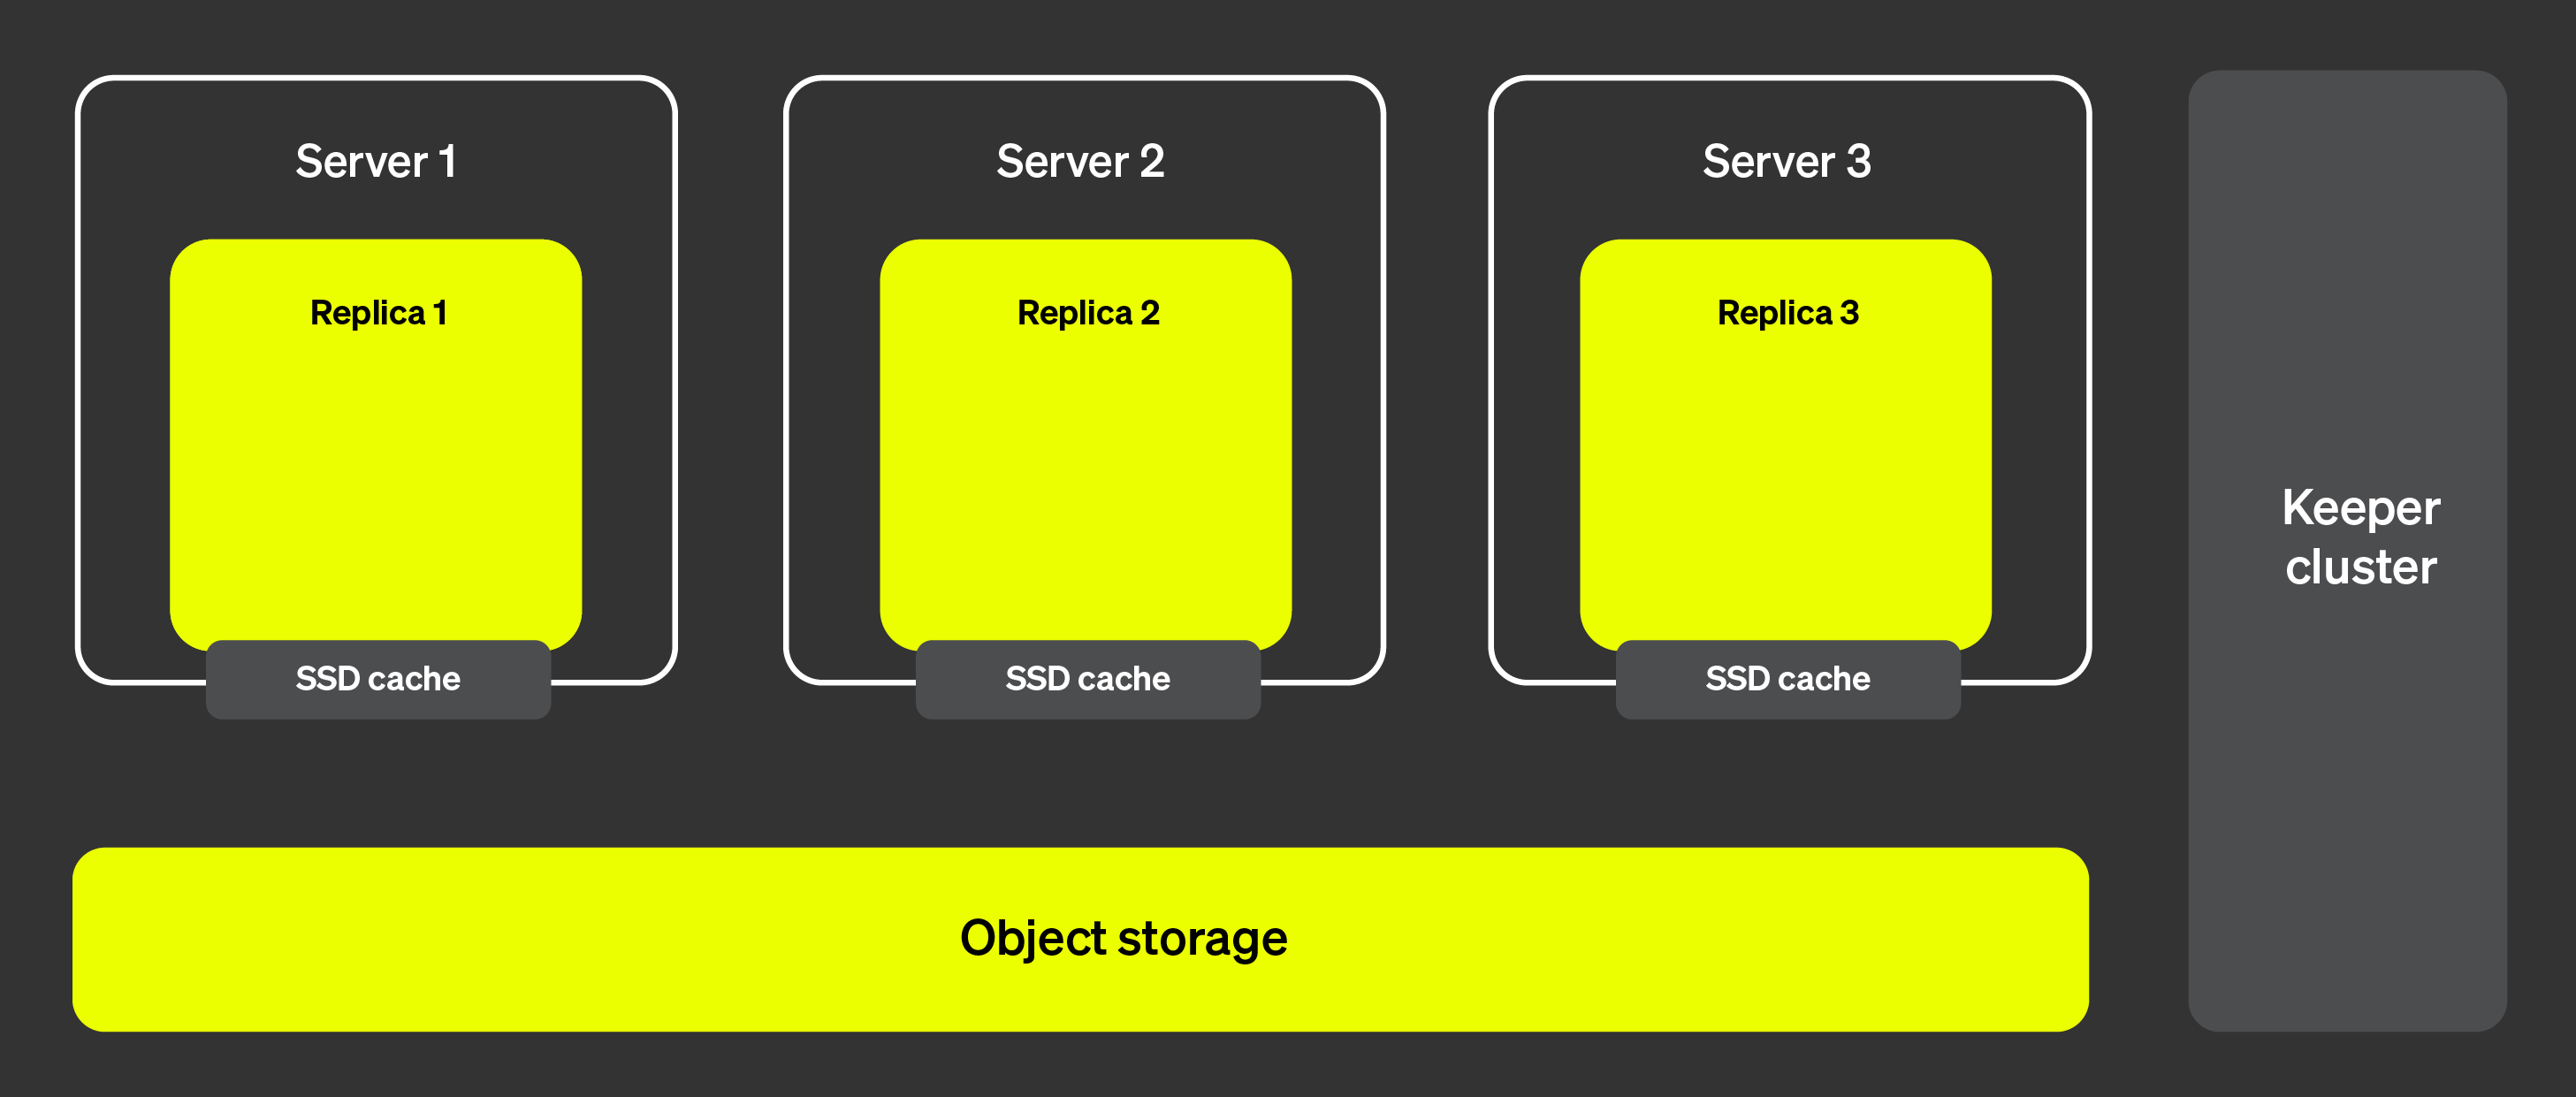
아래 그림은 ClickHouse Cloud 아키텍처를 보여줍니다:
이 아키텍처에서는 레플리카를 거의 즉시 추가하거나 제거할 수 있어
클러스터 확장성을 매우 높게 유지할 수 있습니다. 오른쪽에 표시된
ClickHouse Keeper 클러스터는 메타데이터에 대한 단일한 소스 역할을
합니다. 레플리카는 ClickHouse Keeper 클러스터에서 메타데이터를
가져와 모두 동일한 데이터를 유지합니다. 실제 데이터는 객체 스토리지에
저장되며, SSD 캐시는 쿼리 실행 속도를 높이는 데 사용됩니다.
그렇다면 이제 쿼리 실행을 여러 서버에 어떻게 분산할 수 있을까요? 세그먼트가
있는 아키텍처에서는 각 세그먼트가 실제로 데이터의 부분 집합에 대해 쿼리를
실행할 수 있었기 때문에 비교적 명확했습니다. 세그먼트가 없는 경우에는
어떻게 동작할까요?
병렬 레플리카 소개
여러 서버를 통해 쿼리 실행을 병렬화하려면 먼저 서버 중 하나를 코디네이터로
지정할 수 있어야 합니다. 코디네이터는 실행해야 할 작업 목록을 생성하고,
모든 작업이 실행·집계되었는지, 그리고 결과가 클라이언트에 반환되었는지
확인하는 역할을 합니다. 대부분의 분산 시스템과 마찬가지로, 이는 최초 쿼리를
수신하는 노드가 맡게 됩니다. 또한 작업 단위를 정의할 필요가 있습니다.
세그먼트 아키텍처에서는 작업 단위가 데이터의 부분 집합인 세그먼트입니다.
병렬 레플리카에서는 테이블의 일부분인
granules를
작업 단위로 사용합니다.
이제 아래 그림을 보면서 실제로 어떻게 동작하는지 살펴보겠습니다.
병렬 레플리카의 동작 방식은 다음과 같습니다.
클라이언트의 쿼리는 로드 밸런서를 거쳐 하나의 노드로 전송됩니다.
이 노드가 해당 쿼리의 코디네이터가 됩니다.
이 노드는 각 파트의 인덱스를 분석하고, 처리할 적절한 파트와
그래뉼을 선택합니다.
코디네이터는 워크로드를 여러 레플리카에 할당할 수 있는
그래뉼 집합으로 분할합니다.
각 그래뉼 집합은 해당 레플리카에서 처리되고, 처리가 완료되면
병합 가능한 중간 상태가 코디네이터로 전송됩니다.
마지막으로 코디네이터는 모든 레플리카의 결과를 병합한 뒤
응답을 클라이언트에 반환합니다.
위 단계는 병렬 레플리카가 이론적으로 어떻게 동작하는지 개략적으로 설명합니다.
그러나 실제 환경에서는 이러한 로직이 완벽하게 동작하는 것을 방해하는
요인이 많이 존재합니다.
일부 레플리카는 사용하지 못할 수 있습니다.
ClickHouse의 복제는 비동기 방식이므로, 특정 시점에는
일부 레플리카가 동일한 파트를 가지고 있지 않을 수 있습니다.
레플리카 간 테일 레이턴시(tail latency)를 적절히 처리해야 합니다.
파일 시스템 캐시는 각 레플리카의 활동에 따라 레플리카마다 달라지므로,
작업을 무작위로 할당하면 캐시 지역성을 고려했을 때
성능이 최적보다 떨어질 수 있습니다.
다음 섹션에서 이러한 요인을 어떻게 극복하는지 살펴봅니다.
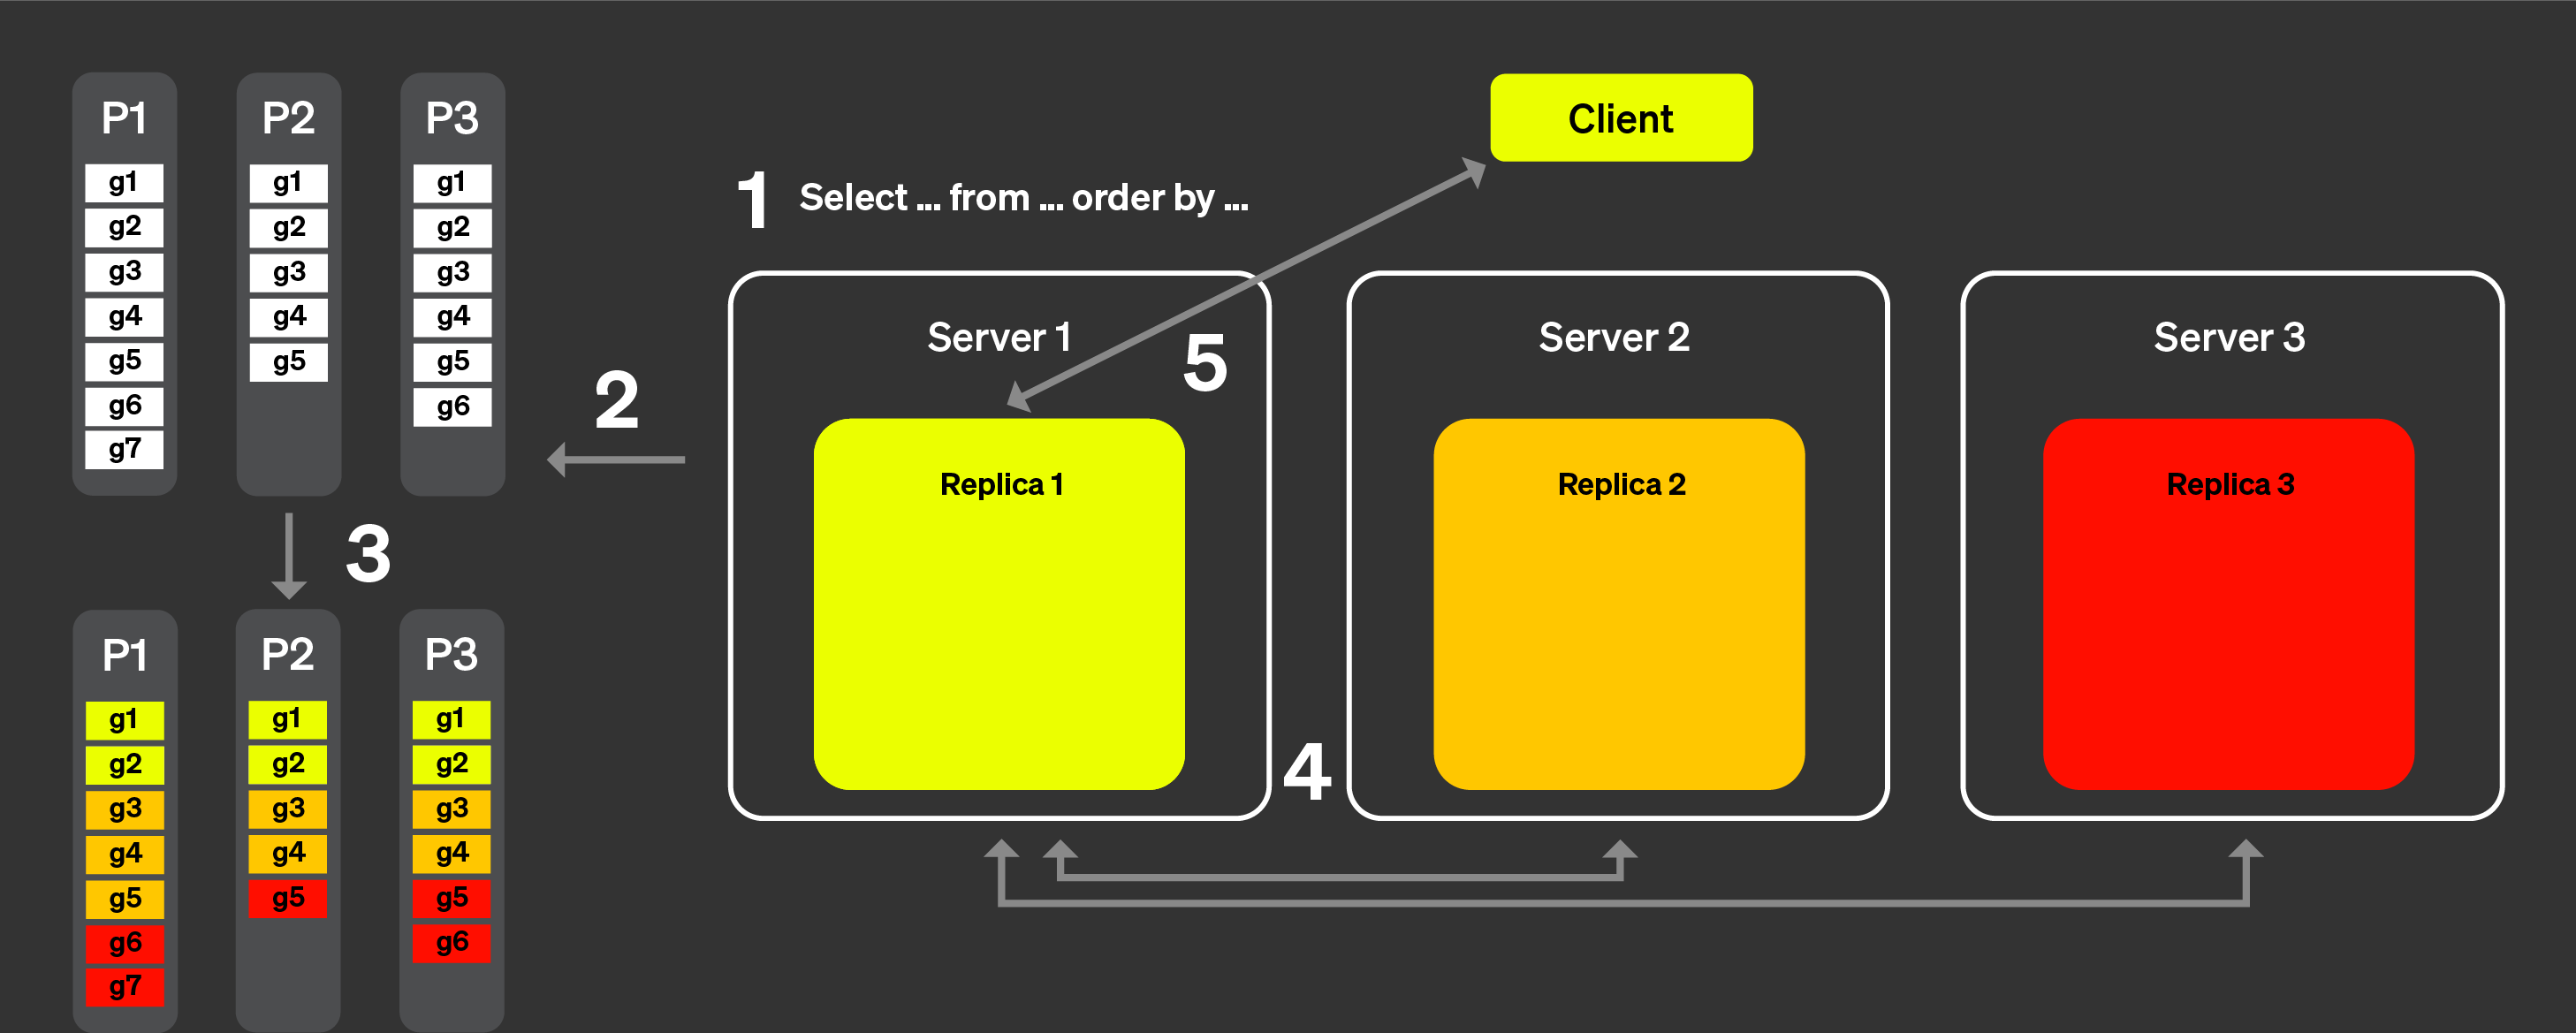
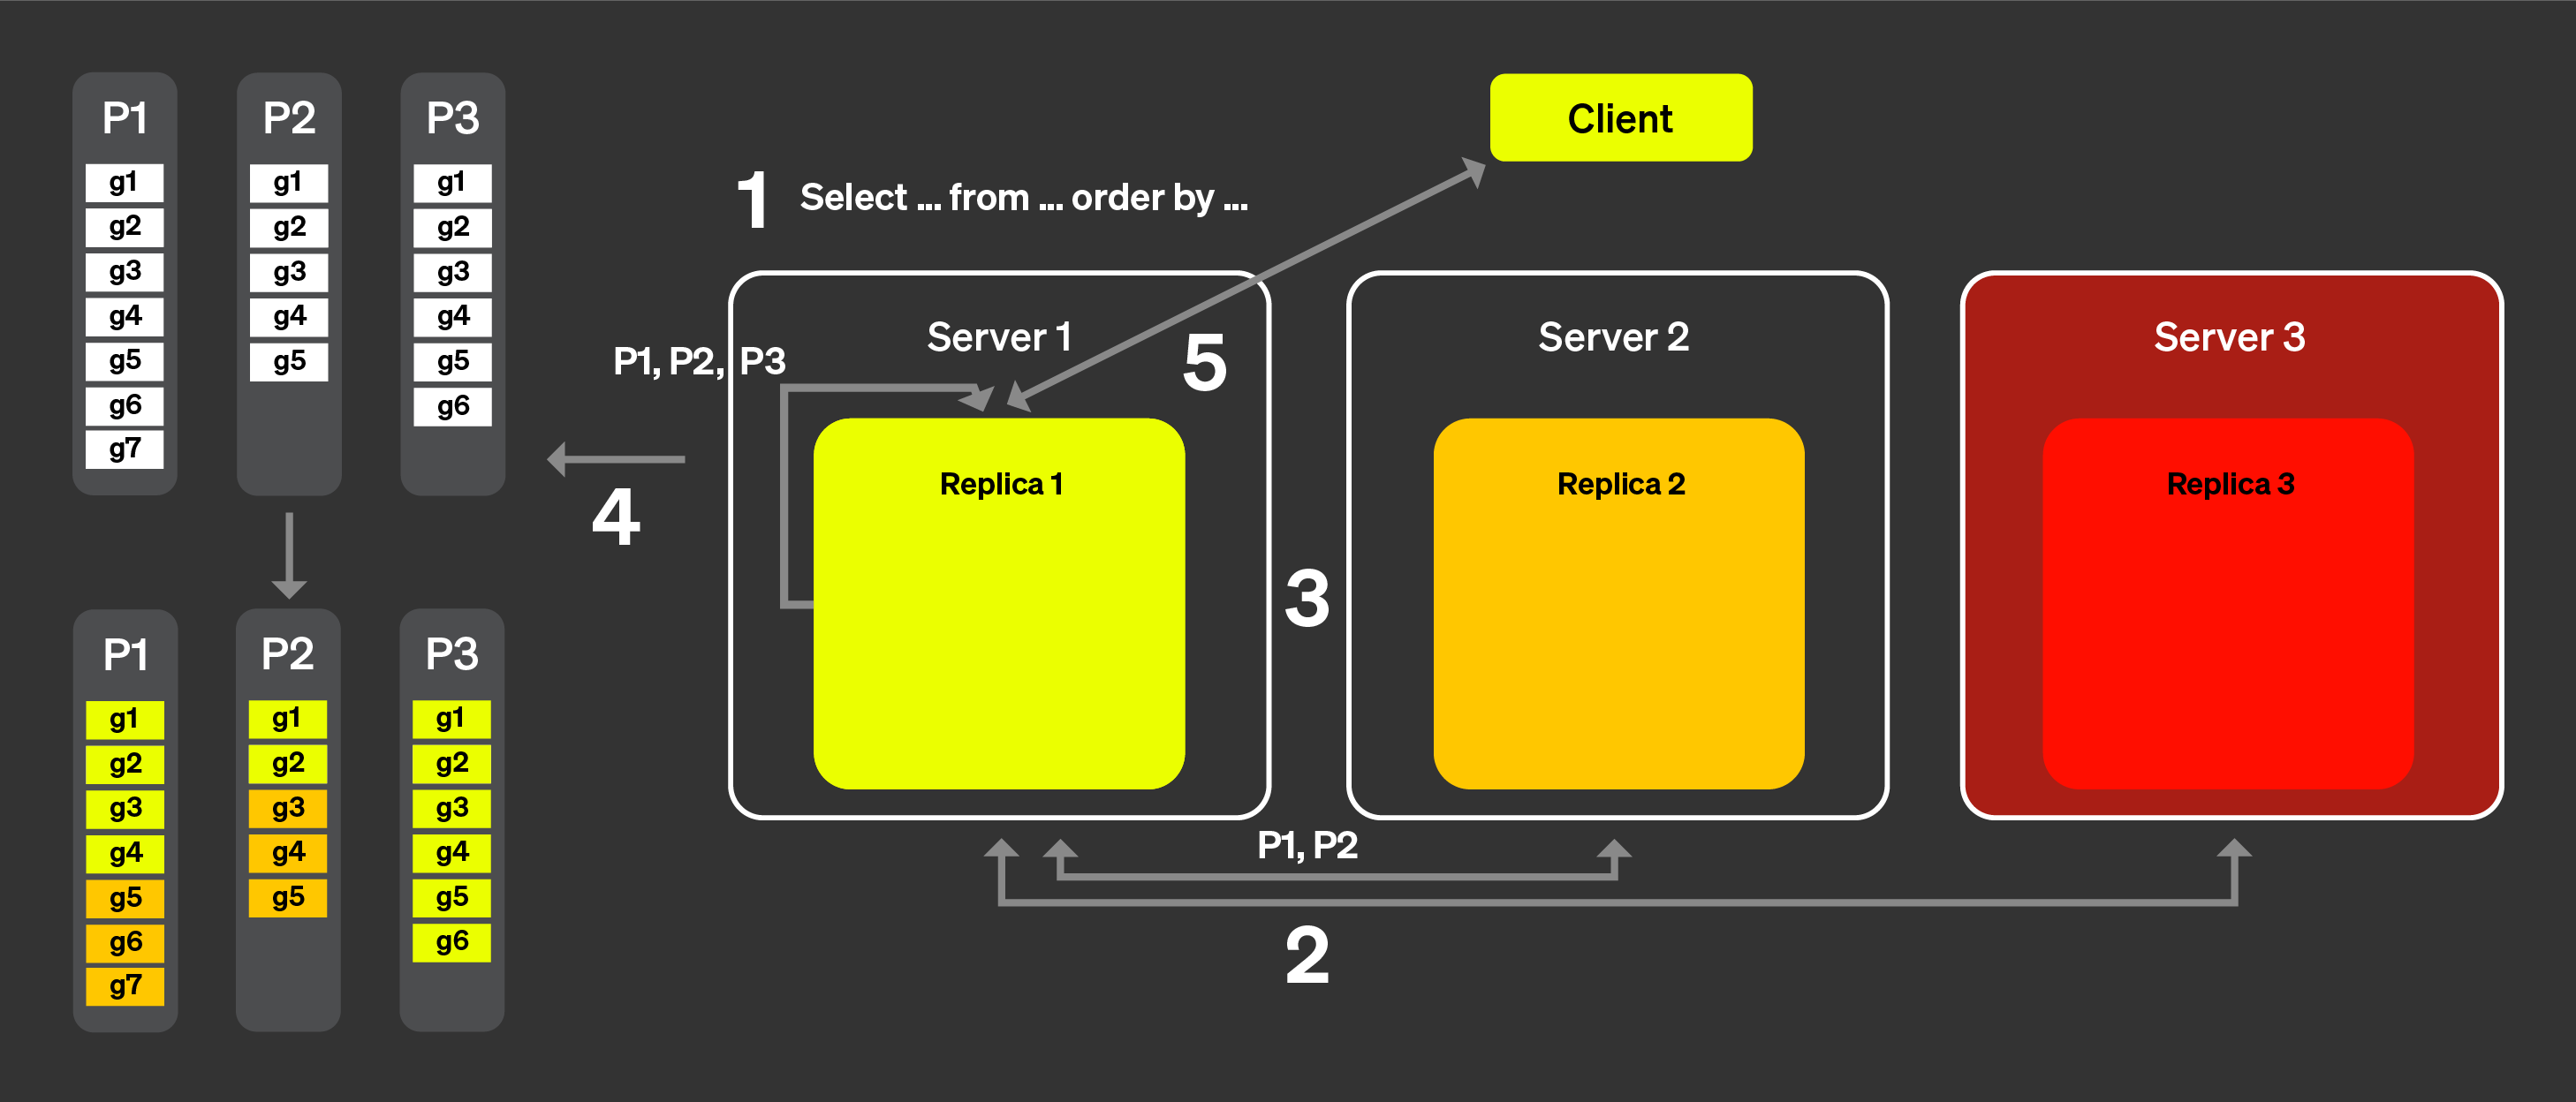
위 목록의 (1)과 (2)를 해결하기 위해 「announcement」라는 개념을 도입했습니다. 아래 그림을 보면서 동작 방식을 살펴보겠습니다:
클라이언트의 쿼리는 로드 밸런서를 거쳐 하나의 노드로 전송됩니다.
이 노드는 해당 쿼리에 대한 코디네이터가 됩니다.
코디네이터 노드는 클러스터의 모든 레플리카에 announcement를
요청합니다. 레플리카는 테이블에 대한 현재 파트 집합을 서로
약간씩 다르게 보고 있을 수 있습니다. 따라서 잘못된 스케줄링
결정을 피하려면 이 정보를 수집해야 합니다.
그런 다음 코디네이터 노드는 수집된 announcement를 사용하여 서로
다른 레플리카에 할당할 수 있는 그래뉼 집합을 정의합니다. 예를 들어,
여기서는 레플리카 2가 자신의 announcement에서 이 파트를 제공하지
않았기 때문에 파트 3의 그래뉼이 레플리카 2에 전혀 할당되지
않았음을 볼 수 있습니다. 또한 레플리카 3이 어떤 announcement도
제공하지 않았으므로 레플리카 3에는 작업이 전혀 할당되지 않았다는
점에도 주목하십시오.
각 레플리카가 자신에게 할당된 그래뉼 부분 집합에 대해 쿼리를
처리하고, 머지 가능한 상태를 코디네이터로 다시 전송하면,
코디네이터는 결과를 머지한 뒤 응답을 클라이언트로 전송합니다.
동적 코디네이션
테일 레이턴시 문제를 해결하기 위해 동적 코디네이션을 도입했습니다. 이는
모든 그래뉼을 한 번의 요청으로 레플리카에 전송하는 것이 아니라, 각 레플리카가
코디네이터에 새로운 작업(처리할 그래뉼 집합)을 요청할 수 있게 된다는 의미입니다.
코디네이터는 수신한 알림에 기반하여 레플리카에 그래뉼 집합을 할당합니다.
모든 레플리카가 모든 파트에 대한 알림을 보낸 상태라고 가정하겠습니다.
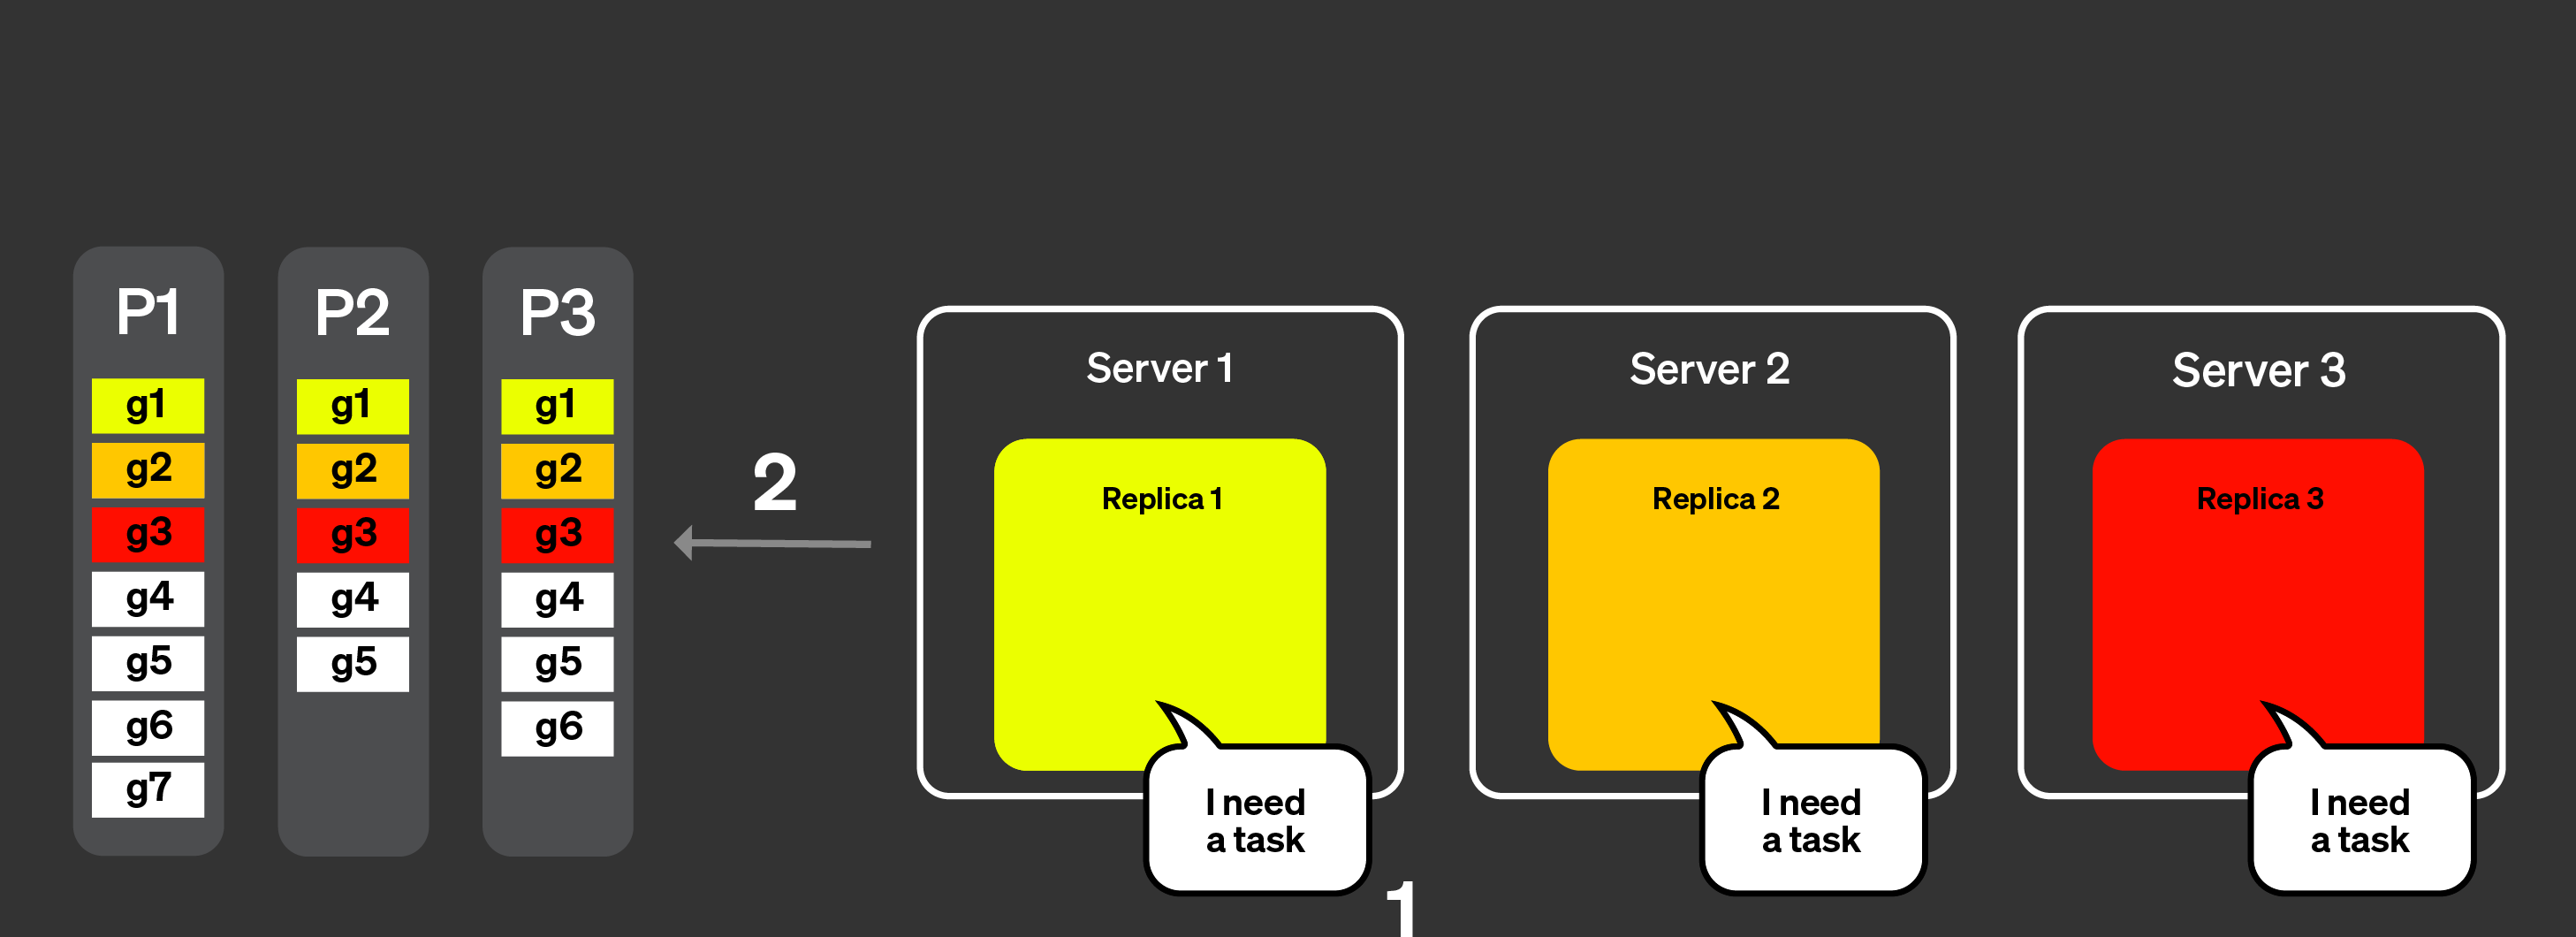
아래 그림은 동적 코디네이션이 어떻게 동작하는지 시각적으로 보여 줍니다:
레플리카는 작업을 처리할 수 있음을 코디네이터 노드에 알리며,
처리할 수 있는 작업량을 함께 지정할 수도 있습니다.
코디네이터는 레플리카에 작업을 할당합니다.
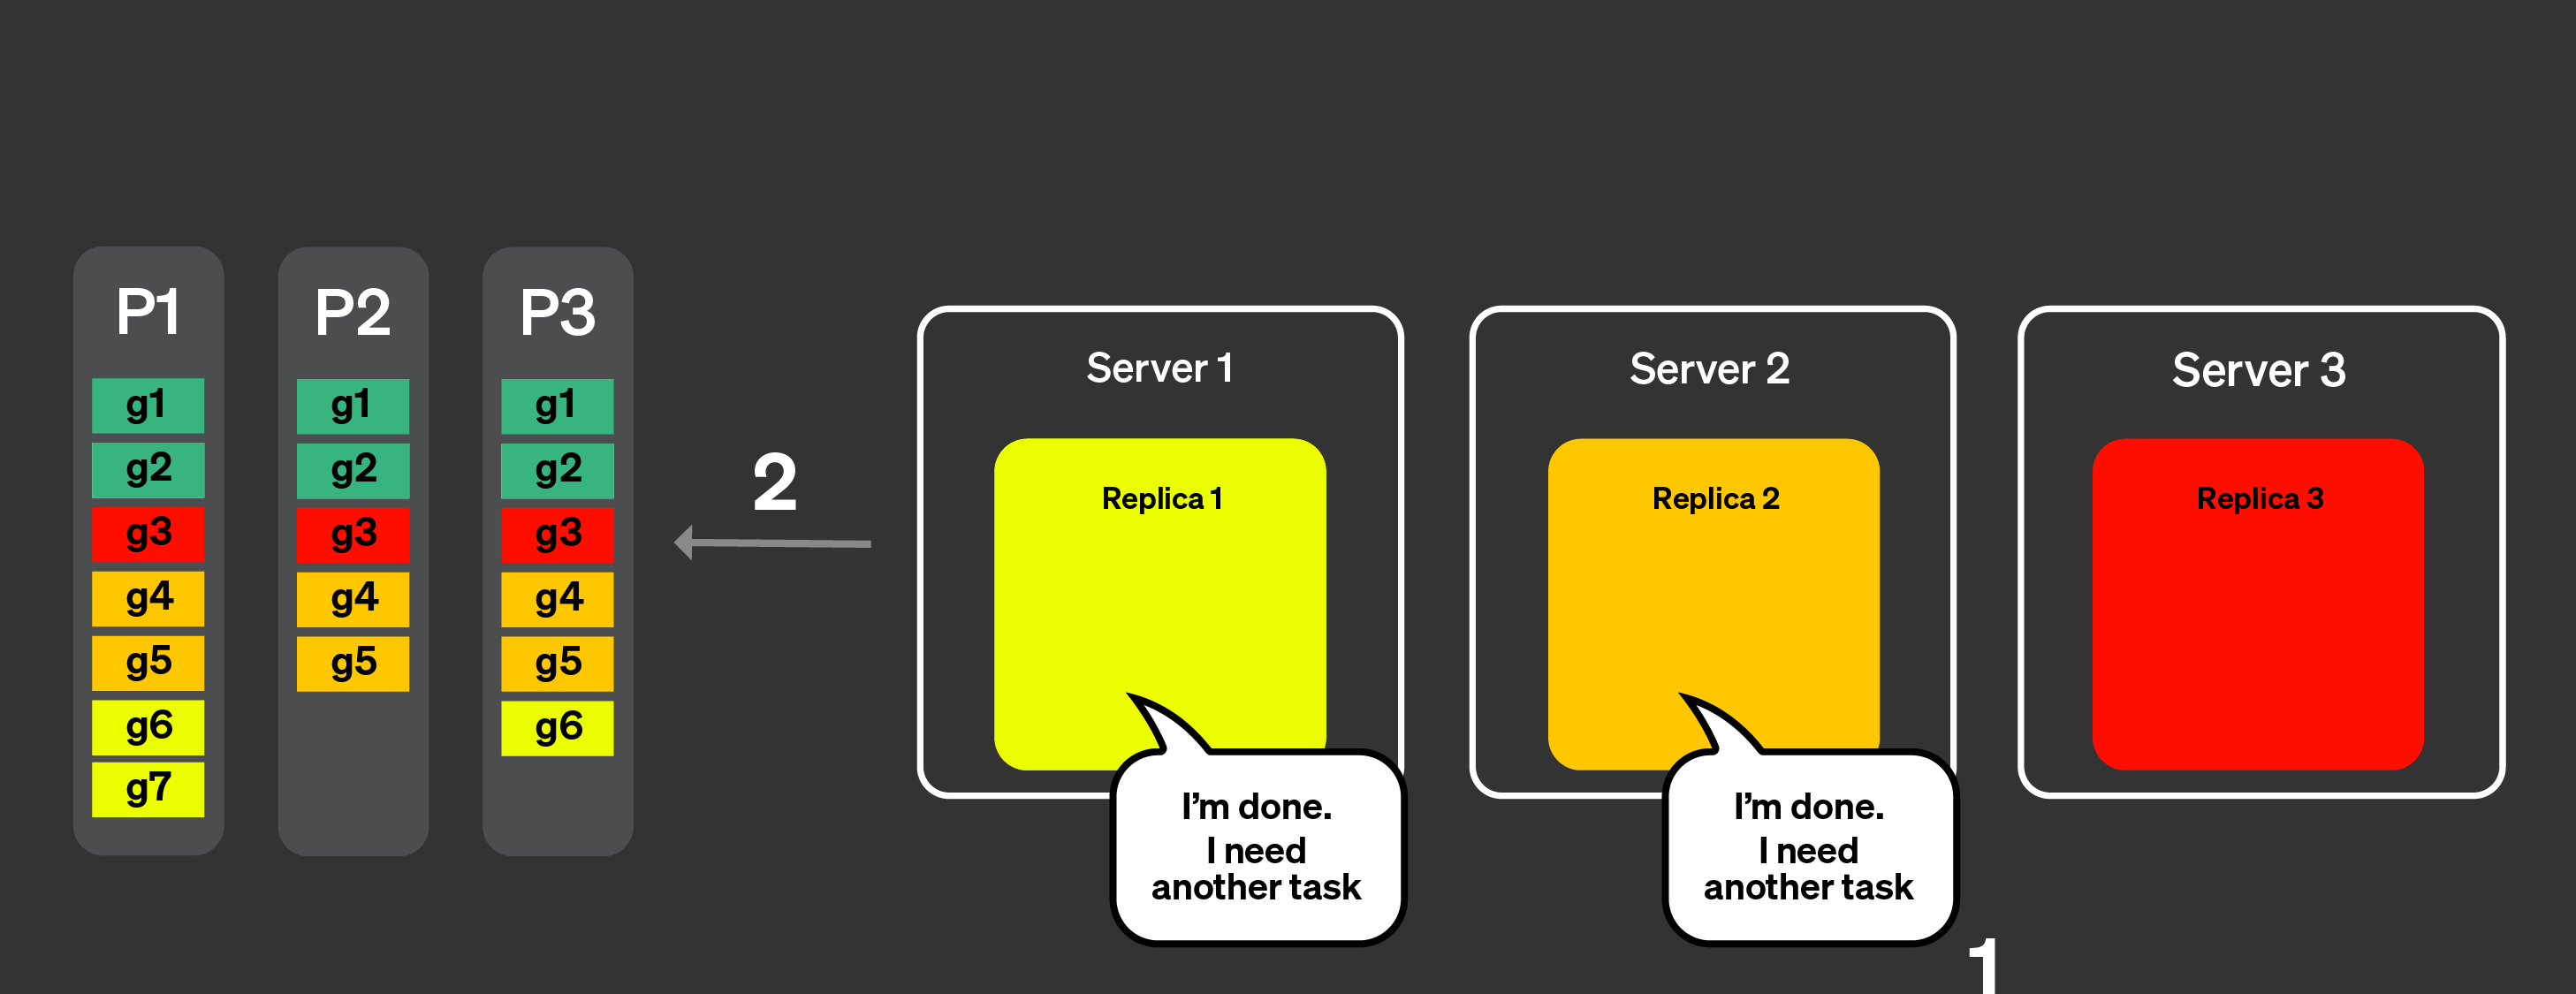
레플리카 1과 2는 작업을 매우 빠르게 완료합니다.
그런 다음 코디네이터 노드에 또 다른 작업을 요청합니다.
코디네이터는 레플리카 1과 2에 새로운 작업을 할당합니다.
이제 모든 레플리카가 작업 처리를 완료했습니다.
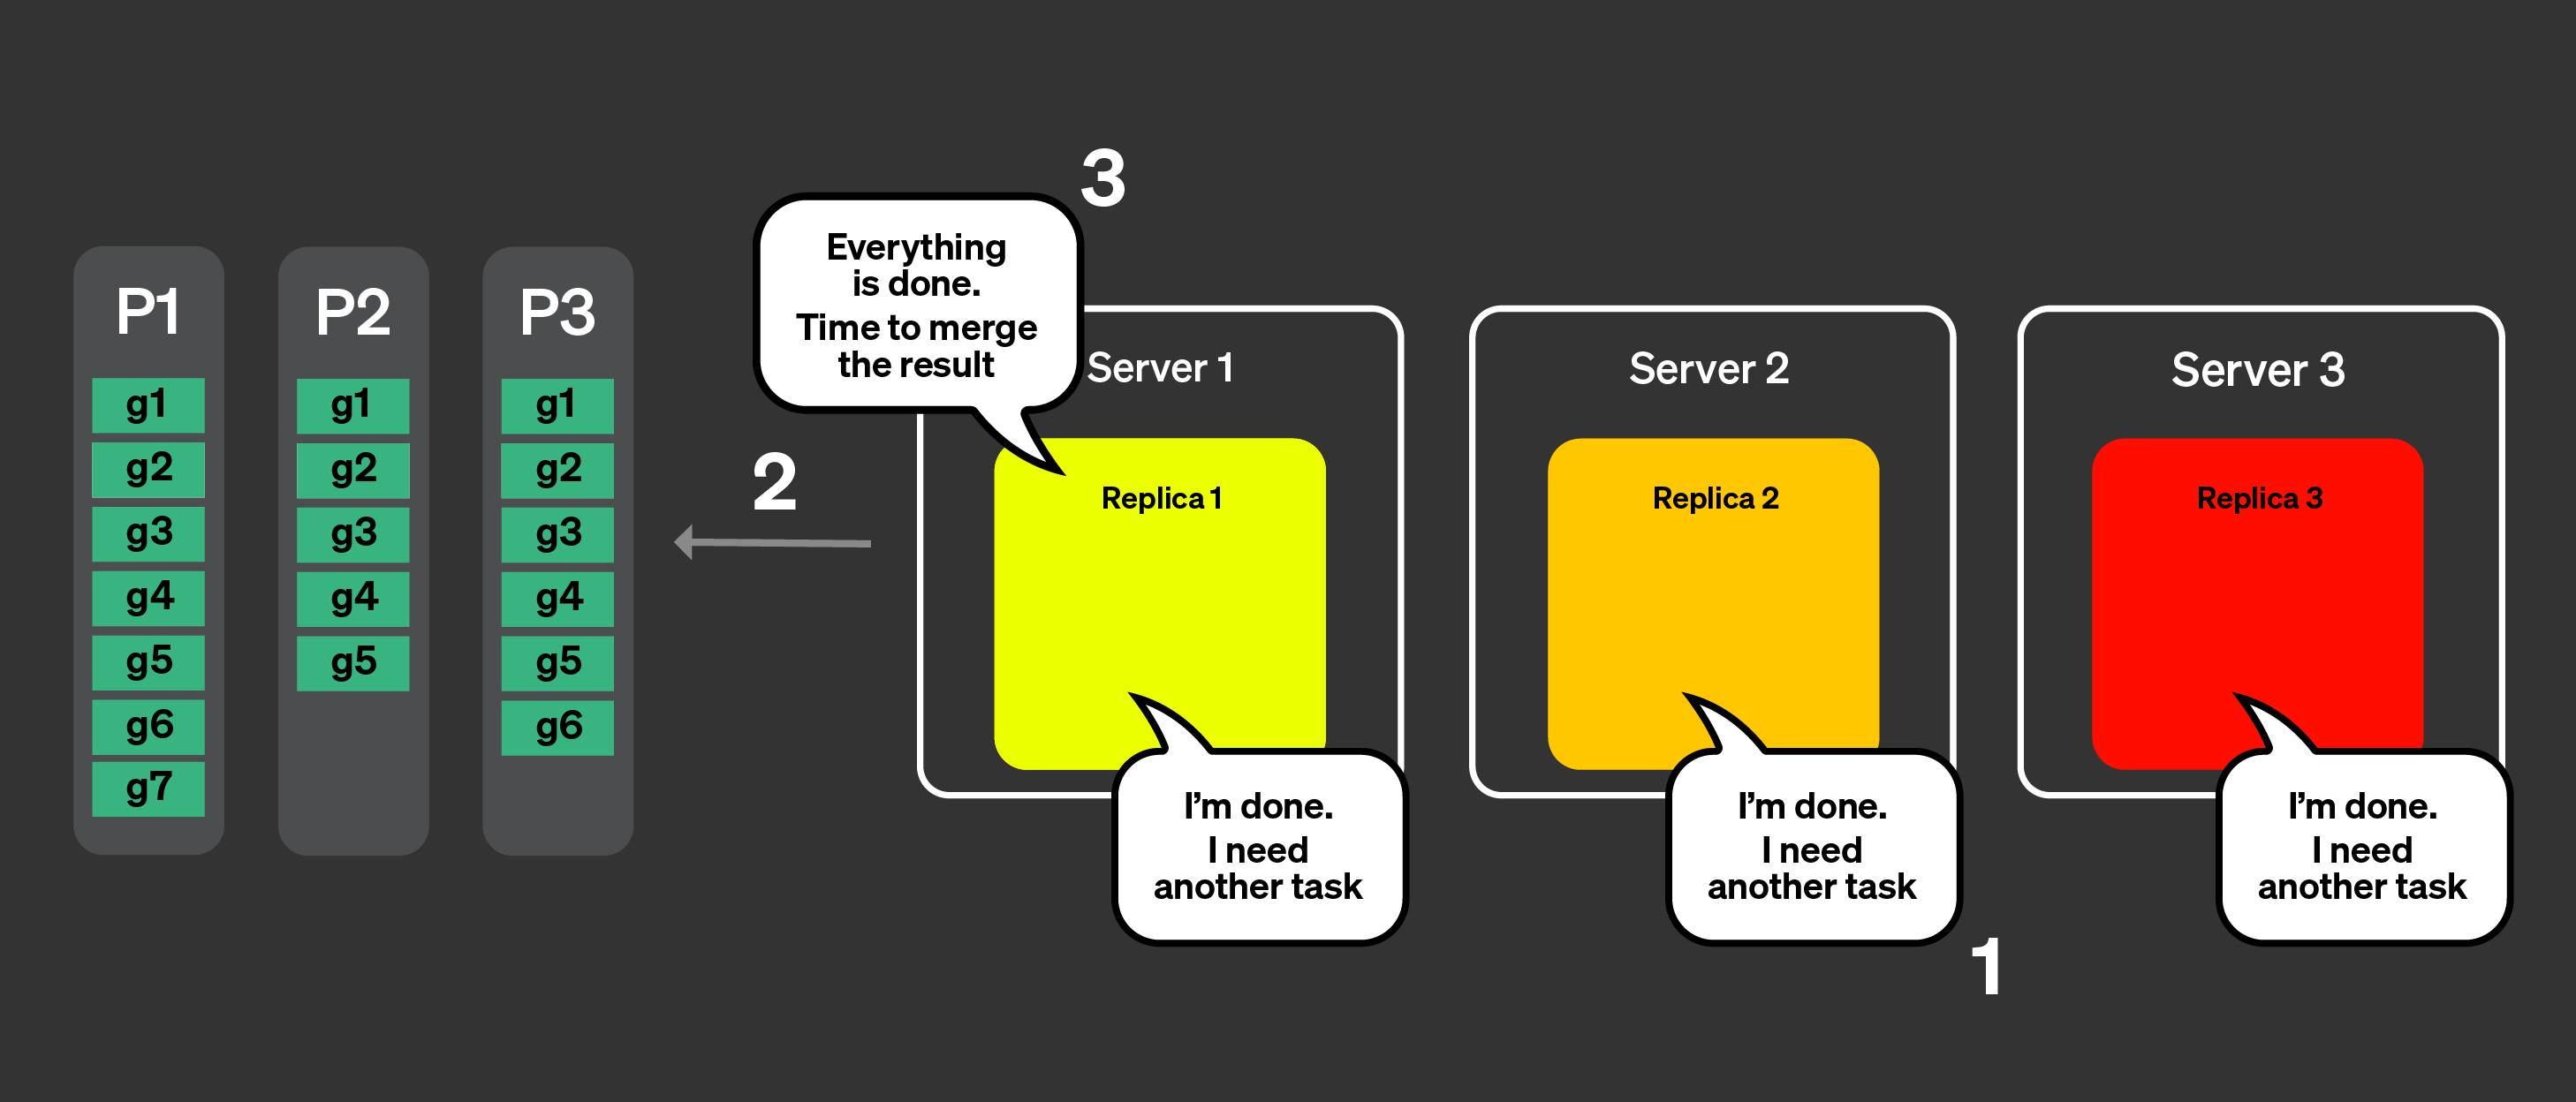
추가 작업을 요청합니다.
코디네이터는 알림을 사용하여 어떤 작업이 남아 있는지 확인하지만,
남아 있는 작업은 없습니다.
코디네이터는 모든 처리가 완료되었음을 레플리카에 알립니다.
이제 병합 가능한 상태를 모두 병합하고 쿼리에 응답합니다.
캐시 지역성 관리
마지막으로 남은 잠재적인 문제는 캐시 지역성을 어떻게 처리할 것인가입니다. 쿼리가
여러 번 실행될 때 같은 태스크가 항상 같은 레플리카로 라우팅되도록 하려면
어떻게 보장할 수 있습니까? 이전 예시에서는 다음과 같이 태스크가 할당되어 있었습니다.
| 레플리카 1 | 레플리카 2 | 레플리카 3 |
|---|
| 파트 1 | g1, g6, g7 | g2, g4, g5 | g3 |
| 파트 2 | g1 | g2, g4, g5 | g3 |
| 파트 3 | g1, g6 | g2, g4, g5 | g3 |
동일한 태스크가 동일한 레플리카에 할당되어 캐시의 이점을 얻을 수 있도록 하려면
두 가지 작업이 수행됩니다. 먼저 파트와 그래뉼 집합(하나의 태스크)에 대한 해시를
계산합니다. 그런 다음 태스크 할당을 위해 레플리카 개수로 모듈로(modulo) 연산을
적용합니다.
이론적으로는 좋아 보이지만, 실제로는 특정 레플리카에 갑작스러운 부하가 생기거나
네트워크 품질이 저하되면, 특정 태스크를 실행하는 데 같은 레플리카가 지속적으로
사용되는 경우 테일 지연이 발생할 수 있습니다. max_parallel_replicas가
레플리카 개수보다 작은 경우에는 쿼리 실행을 위해 무작위 레플리카가 선택됩니다.
Task stealing
일부 레플리카가 다른 레플리카보다 작업을 더 느리게 처리하는 경우, 다른 레플리카는 테일 지연 시간(tail latency)을 줄이기 위해 해시를 기준으로 원래 해당 레플리카에 할당된 작업을 '훔쳐서' 처리하려고 합니다.
Limitations
이 기능에는 이미 알려진 제한 사항이 있으며, 그중 주요한 것들이 이 섹션에 정리되어 있습니다.
참고
아래에 제시된 제한 사항에 해당하지 않는 문제를 발견했고 그 원인이 병렬 레플리카라고 의심된다면, GitHub에서 comp-parallel-replicas 레이블을 사용하여 이슈를 등록하십시오.
| Limitation | Description |
|---|
| Complex queries | 현재 병렬 레플리카는 단순한 쿼리에서는 상당히 잘 동작합니다. CTE, 서브쿼리, JOIN, non-flat 쿼리 등과 같이 쿼리의 복잡성을 높이는 요소들은 쿼리 성능에 부정적인 영향을 줄 수 있습니다. |
| Small queries | 많은 행을 처리하지 않는 쿼리를 실행하는 경우, 여러 레플리카에서 실행하더라도 레플리카 간 조정을 위한 네트워크 소요 시간으로 인해 쿼리 실행에 추가 오버헤드가 발생하여 성능 향상이 나타나지 않을 수 있습니다. 이러한 문제는 설정 parallel_replicas_min_number_of_rows_per_replica를 사용하여 완화할 수 있습니다. |
| Parallel replicas are disabled with FINAL | |
| Projections aren't used together with Parallel replicas | |
| High Cardinality data and complex aggregation | 많은 데이터를 전송해야 하는 고 카디널리티 집계는 쿼리를 상당히 느리게 만들 수 있습니다. |
| Compatibility with the new analyzer | 새로운 analyzer는 특정 시나리오에서 쿼리 실행 시간을 크게 늘리거나 줄일 수 있습니다. |
| Setting | Description |
|---|
enable_parallel_replicas | 0: 비활성화
1: 활성화
2: 병렬 레플리카 사용을 강제하며, 병렬 레플리카가 사용되지 못하면 예외가 발생합니다. |
cluster_for_parallel_replicas | 병렬 레플리카를 위해 사용할 클러스터 이름입니다. ClickHouse Cloud를 사용하는 경우 default를 사용합니다. |
max_parallel_replicas | 여러 레플리카에서 쿼리를 실행할 때 사용할 레플리카의 최대 개수입니다. 클러스터의 레플리카 개수보다 작은 값을 지정하면 노드가 임의로 선택됩니다. 이 값은 수평 확장을 고려하여 초과할당(overcommit)하여 설정할 수도 있습니다. |
parallel_replicas_min_number_of_rows_per_replica | 처리해야 하는 행 수를 기준으로 사용되는 레플리카 수를 제한하는 데 도움이 됩니다. 사용되는 레플리카 수는 다음과 같이 정의됩니다:
estimated rows to read / min_number_of_rows_per_replica. |
enable_analyzer | 병렬 레플리카를 사용한 쿼리 실행은 analyzer가 활성화되어 있는 경우에만 지원됩니다. |
병렬 레플리카 관련 문제 조사
각 쿼리에 대해 어떤 설정이 사용되었는지는
system.query_log 테이블에서 확인할 수 있습니다. 또한
서버에서 발생한 모든 이벤트는 system.events
테이블에서 확인할 수 있으며,
clusterAllReplicas 테이블 함수를 사용하면 모든 레플리카에 있는 테이블을
확인할 수 있습니다(Cloud 사용자라면 default를 사용하십시오).
SELECT
   hostname(),
   *
FROM clusterAllReplicas('default', system.events)
WHERE event ILIKE '%ParallelReplicas%'
응답
┌─hostname()───────────────────────┬─event──────────────────────────────────────────┬─value─┬─description──────────────────────────────────────────────────────────────────────────────────────────┐
│ c-crimson-vd-86-server-rdhnsx3-0 │ ParallelReplicasHandleRequestMicroseconds      │   438 │ Time spent processing requests for marks from replicas                                               │
│ c-crimson-vd-86-server-rdhnsx3-0 │ ParallelReplicasHandleAnnouncementMicroseconds │   558 │ Time spent processing replicas announcements                                                         │
│ c-crimson-vd-86-server-rdhnsx3-0 │ ParallelReplicasReadUnassignedMarks            │   240 │ Sum across all replicas of how many unassigned marks were scheduled                                  │
│ c-crimson-vd-86-server-rdhnsx3-0 │ ParallelReplicasReadAssignedForStealingMarks   │     4 │ Sum across all replicas of how many of scheduled marks were assigned for stealing by consistent hash │
│ c-crimson-vd-86-server-rdhnsx3-0 │ ParallelReplicasStealingByHashMicroseconds     │     5 │ Time spent collecting segments meant for stealing by hash                                            │
│ c-crimson-vd-86-server-rdhnsx3-0 │ ParallelReplicasProcessingPartsMicroseconds    │     5 │ Time spent processing data parts                                                                     │
│ c-crimson-vd-86-server-rdhnsx3-0 │ ParallelReplicasStealingLeftoversMicroseconds  │     3 │ Time spent collecting orphaned segments                                                              │
│ c-crimson-vd-86-server-rdhnsx3-0 │ ParallelReplicasUsedCount                      │     2 │ Number of replicas used to execute a query with task-based parallel replicas                         │
│ c-crimson-vd-86-server-rdhnsx3-0 │ ParallelReplicasAvailableCount                 │     6 │ Number of replicas available to execute a query with task-based parallel replicas                    │
└──────────────────────────────────┴────────────────────────────────────────────────┴───────┴──────────────────────────────────────────────────────────────────────────────────────────────────────┘
┌─hostname()───────────────────────┬─event──────────────────────────────────────────┬─value─┬─description──────────────────────────────────────────────────────────────────────────────────────────┐
│ c-crimson-vd-86-server-e9kp5f0-0 │ ParallelReplicasHandleRequestMicroseconds      │   698 │ Time spent processing requests for marks from replicas                                               │
│ c-crimson-vd-86-server-e9kp5f0-0 │ ParallelReplicasHandleAnnouncementMicroseconds │   644 │ Time spent processing replicas announcements                                                         │
│ c-crimson-vd-86-server-e9kp5f0-0 │ ParallelReplicasReadUnassignedMarks            │   190 │ Sum across all replicas of how many unassigned marks were scheduled                                  │
│ c-crimson-vd-86-server-e9kp5f0-0 │ ParallelReplicasReadAssignedForStealingMarks   │    54 │ Sum across all replicas of how many of scheduled marks were assigned for stealing by consistent hash │
│ c-crimson-vd-86-server-e9kp5f0-0 │ ParallelReplicasStealingByHashMicroseconds     │     8 │ Time spent collecting segments meant for stealing by hash                                            │
│ c-crimson-vd-86-server-e9kp5f0-0 │ ParallelReplicasProcessingPartsMicroseconds    │     4 │ Time spent processing data parts                                                                     │
│ c-crimson-vd-86-server-e9kp5f0-0 │ ParallelReplicasStealingLeftoversMicroseconds  │     2 │ Time spent collecting orphaned segments                                                              │
│ c-crimson-vd-86-server-e9kp5f0-0 │ ParallelReplicasUsedCount                      │     2 │ Number of replicas used to execute a query with task-based parallel replicas                         │
│ c-crimson-vd-86-server-e9kp5f0-0 │ ParallelReplicasAvailableCount                 │     6 │ Number of replicas available to execute a query with task-based parallel replicas                    │
└──────────────────────────────────┴────────────────────────────────────────────────┴───────┴──────────────────────────────────────────────────────────────────────────────────────────────────────┘
┌─hostname()───────────────────────┬─event──────────────────────────────────────────┬─value─┬─description──────────────────────────────────────────────────────────────────────────────────────────┐
│ c-crimson-vd-86-server-ybtm18n-0 │ ParallelReplicasHandleRequestMicroseconds      │   620 │ Time spent processing requests for marks from replicas                                               │
│ c-crimson-vd-86-server-ybtm18n-0 │ ParallelReplicasHandleAnnouncementMicroseconds │   656 │ Time spent processing replicas announcements                                                         │
│ c-crimson-vd-86-server-ybtm18n-0 │ ParallelReplicasReadUnassignedMarks            │     1 │ Sum across all replicas of how many unassigned marks were scheduled                                  │
│ c-crimson-vd-86-server-ybtm18n-0 │ ParallelReplicasReadAssignedForStealingMarks   │     1 │ Sum across all replicas of how many of scheduled marks were assigned for stealing by consistent hash │
│ c-crimson-vd-86-server-ybtm18n-0 │ ParallelReplicasStealingByHashMicroseconds     │     4 │ Time spent collecting segments meant for stealing by hash                                            │
│ c-crimson-vd-86-server-ybtm18n-0 │ ParallelReplicasProcessingPartsMicroseconds    │     3 │ Time spent processing data parts                                                                     │
│ c-crimson-vd-86-server-ybtm18n-0 │ ParallelReplicasStealingLeftoversMicroseconds  │     1 │ Time spent collecting orphaned segments                                                              │
│ c-crimson-vd-86-server-ybtm18n-0 │ ParallelReplicasUsedCount                      │     2 │ Number of replicas used to execute a query with task-based parallel replicas                         │
│ c-crimson-vd-86-server-ybtm18n-0 │ ParallelReplicasAvailableCount                 │    12 │ Number of replicas available to execute a query with task-based parallel replicas                    │
└──────────────────────────────────┴────────────────────────────────────────────────┴───────┴──────────────────────────────────────────────────────────────────────────────────────────────────────┘
┌─hostname()───────────────────────┬─event──────────────────────────────────────────┬─value─┬─description──────────────────────────────────────────────────────────────────────────────────────────┐
│ c-crimson-vd-86-server-16j1ncj-0 │ ParallelReplicasHandleRequestMicroseconds      │   696 │ Time spent processing requests for marks from replicas                                               │
│ c-crimson-vd-86-server-16j1ncj-0 │ ParallelReplicasHandleAnnouncementMicroseconds │   717 │ Time spent processing replicas announcements                                                         │
│ c-crimson-vd-86-server-16j1ncj-0 │ ParallelReplicasReadUnassignedMarks            │     2 │ Sum across all replicas of how many unassigned marks were scheduled                                  │
│ c-crimson-vd-86-server-16j1ncj-0 │ ParallelReplicasReadAssignedForStealingMarks   │     2 │ Sum across all replicas of how many of scheduled marks were assigned for stealing by consistent hash │
│ c-crimson-vd-86-server-16j1ncj-0 │ ParallelReplicasStealingByHashMicroseconds     │    10 │ Time spent collecting segments meant for stealing by hash                                            │
│ c-crimson-vd-86-server-16j1ncj-0 │ ParallelReplicasProcessingPartsMicroseconds    │     6 │ Time spent processing data parts                                                                     │
│ c-crimson-vd-86-server-16j1ncj-0 │ ParallelReplicasStealingLeftoversMicroseconds  │     2 │ Time spent collecting orphaned segments                                                              │
│ c-crimson-vd-86-server-16j1ncj-0 │ ParallelReplicasUsedCount                      │     2 │ Number of replicas used to execute a query with task-based parallel replicas                         │
│ c-crimson-vd-86-server-16j1ncj-0 │ ParallelReplicasAvailableCount                 │    12 │ Number of replicas available to execute a query with task-based parallel replicas                    │
└──────────────────────────────────┴────────────────────────────────────────────────┴───────┴──────────────────────────────────────────────────────────────────────────────────────────────────────┘
system.text_log 테이블에는
병렬 레플리카를 사용하여 실행된 쿼리에 대한 정보도 포함합니다.
SELECT message
FROM clusterAllReplicas('default', system.text_log)
WHERE query_id = 'ad40c712-d25d-45c4-b1a1-a28ba8d4019c'
ORDER BY event_time_microseconds ASC
응답
┌─message────────────────────────────────────────────────────────────────────────────────────────────────────────────────────────────────────────────────────────────────────────────────────────────────────────────────────────────────────────────────────┐
│ (from 54.218.178.249:59198) SELECT * FROM session_events WHERE type='type2' LIMIT 10 SETTINGS allow_experimental_parallel_reading_from_replicas=2; (stage: Complete) │
│ Query SELECT __table1.clientId AS clientId, __table1.sessionId AS sessionId, __table1.pageId AS pageId, __table1.timestamp AS timestamp, __table1.type AS type FROM default.session_events AS __table1 WHERE __table1.type = 'type2' LIMIT _CAST(10, 'UInt64') SETTINGS allow_experimental_parallel_reading_from_replicas = 2 to stage Complete │
│ Access granted: SELECT(clientId, sessionId, pageId, timestamp, type) ON default.session_events │
│ Query SELECT __table1.clientId AS clientId, __table1.sessionId AS sessionId, __table1.pageId AS pageId, __table1.timestamp AS timestamp, __table1.type AS type FROM default.session_events AS __table1 WHERE __table1.type = 'type2' LIMIT _CAST(10, 'UInt64') to stage WithMergeableState only analyze │
│ Access granted: SELECT(clientId, sessionId, pageId, timestamp, type) ON default.session_events │
│ Query SELECT __table1.clientId AS clientId, __table1.sessionId AS sessionId, __table1.pageId AS pageId, __table1.timestamp AS timestamp, __table1.type AS type FROM default.session_events AS __table1 WHERE __table1.type = 'type2' LIMIT _CAST(10, 'UInt64') from stage FetchColumns to stage WithMergeableState only analyze │
│ Query SELECT __table1.clientId AS clientId, __table1.sessionId AS sessionId, __table1.pageId AS pageId, __table1.timestamp AS timestamp, __table1.type AS type FROM default.session_events AS __table1 WHERE __table1.type = 'type2' LIMIT _CAST(10, 'UInt64') SETTINGS allow_experimental_parallel_reading_from_replicas = 2 to stage WithMergeableState only analyze │
│ Access granted: SELECT(clientId, sessionId, pageId, timestamp, type) ON default.session_events │
│ Query SELECT __table1.clientId AS clientId, __table1.sessionId AS sessionId, __table1.pageId AS pageId, __table1.timestamp AS timestamp, __table1.type AS type FROM default.session_events AS __table1 WHERE __table1.type = 'type2' LIMIT _CAST(10, 'UInt64') SETTINGS allow_experimental_parallel_reading_from_replicas = 2 from stage FetchColumns to stage WithMergeableState only analyze │
│ Query SELECT __table1.clientId AS clientId, __table1.sessionId AS sessionId, __table1.pageId AS pageId, __table1.timestamp AS timestamp, __table1.type AS type FROM default.session_events AS __table1 WHERE __table1.type = 'type2' LIMIT _CAST(10, 'UInt64') SETTINGS allow_experimental_parallel_reading_from_replicas = 2 from stage WithMergeableState to stage Complete │
│ The number of replicas requested (100) is bigger than the real number available in the cluster (6). Will use the latter number to execute the query. │
│ Initial request from replica 4: 2 parts: [part all_0_2_1 with ranges [(0, 182)], part all_3_3_0 with ranges [(0, 62)]]----------
Received from 4 replica
│
│ Reading state is fully initialized: part all_0_2_1 with ranges [(0, 182)] in replicas [4]; part all_3_3_0 with ranges [(0, 62)] in replicas [4] │
│ Sent initial requests: 1 Replicas count: 6 │
│ Initial request from replica 2: 2 parts: [part all_0_2_1 with ranges [(0, 182)], part all_3_3_0 with ranges [(0, 62)]]----------
Received from 2 replica
│
│ Sent initial requests: 2 Replicas count: 6 │
│ Handling request from replica 4, minimal marks size is 240 │
│ Going to respond to replica 4 with 1 parts: [part all_0_2_1 with ranges [(128, 182)]]. Finish: false; mine_marks=0, stolen_by_hash=54, stolen_rest=0 │
│ Initial request from replica 1: 2 parts: [part all_0_2_1 with ranges [(0, 182)], part all_3_3_0 with ranges [(0, 62)]]----------
Received from 1 replica
│
│ Sent initial requests: 3 Replicas count: 6 │
│ Handling request from replica 4, minimal marks size is 240 │
│ Going to respond to replica 4 with 2 parts: [part all_0_2_1 with ranges [(0, 128)], part all_3_3_0 with ranges [(0, 62)]]. Finish: false; mine_marks=0, stolen_by_hash=0, stolen_rest=190 │
│ Initial request from replica 0: 2 parts: [part all_0_2_1 with ranges [(0, 182)], part all_3_3_0 with ranges [(0, 62)]]----------
Received from 0 replica
│
│ Sent initial requests: 4 Replicas count: 6 │
│ Initial request from replica 5: 2 parts: [part all_0_2_1 with ranges [(0, 182)], part all_3_3_0 with ranges [(0, 62)]]----------
Received from 5 replica
│
│ Sent initial requests: 5 Replicas count: 6 │
│ Handling request from replica 2, minimal marks size is 240 │
│ Going to respond to replica 2 with 0 parts: []. Finish: true; mine_marks=0, stolen_by_hash=0, stolen_rest=0 │
│ Initial request from replica 3: 2 parts: [part all_0_2_1 with ranges [(0, 182)], part all_3_3_0 with ranges [(0, 62)]]----------
Received from 3 replica
│
│ Sent initial requests: 6 Replicas count: 6 │
│ Total rows to read: 2000000 │
│ Handling request from replica 5, minimal marks size is 240 │
│ Going to respond to replica 5 with 0 parts: []. Finish: true; mine_marks=0, stolen_by_hash=0, stolen_rest=0 │
│ Handling request from replica 0, minimal marks size is 240 │
│ Going to respond to replica 0 with 0 parts: []. Finish: true; mine_marks=0, stolen_by_hash=0, stolen_rest=0 │
│ Handling request from replica 1, minimal marks size is 240 │
│ Going to respond to replica 1 with 0 parts: []. Finish: true; mine_marks=0, stolen_by_hash=0, stolen_rest=0 │
│ Handling request from replica 3, minimal marks size is 240 │
│ Going to respond to replica 3 with 0 parts: []. Finish: true; mine_marks=0, stolen_by_hash=0, stolen_rest=0 │
│ (c-crimson-vd-86-server-rdhnsx3-0.c-crimson-vd-86-server-headless.ns-crimson-vd-86.svc.cluster.local:9000) Cancelling query because enough data has been read │
│ Read 81920 rows, 5.16 MiB in 0.013166 sec., 6222087.194288318 rows/sec., 391.63 MiB/sec. │
│ Coordination done: Statistics: replica 0 - {requests: 2 marks: 0 assigned_to_me: 0 stolen_by_hash: 0 stolen_unassigned: 0}; replica 1 - {requests: 2 marks: 0 assigned_to_me: 0 stolen_by_hash: 0 stolen_unassigned: 0}; replica 2 - {requests: 2 marks: 0 assigned_to_me: 0 stolen_by_hash: 0 stolen_unassigned: 0}; replica 3 - {requests: 2 marks: 0 assigned_to_me: 0 stolen_by_hash: 0 stolen_unassigned: 0}; replica 4 - {requests: 3 marks: 244 assigned_to_me: 0 stolen_by_hash: 54 stolen_unassigned: 190}; replica 5 - {requests: 2 marks: 0 assigned_to_me: 0 stolen_by_hash: 0 stolen_unassigned: 0} │
│ Peak memory usage (for query): 1.81 MiB. │
│ Processed in 0.024095586 sec. │
└────────────────────────────────────────────────────────────────────────────────────────────────────────────────────────────────────────────────────────────────────────────────────────────────────────────────────────────────────────────────────────────┘
마지막으로 EXPLAIN PIPELINE을 사용할 수도 있습니다. 이 명령은 ClickHouse가
쿼리를 어떻게 실행하는지, 그리고 쿼리 실행에 어떤 리소스를 사용하는지를 강조하여 보여줍니다.
예를 들어, 다음 쿼리를 살펴보겠습니다.
SELECT count(), uniq(pageId) , min(timestamp), max(timestamp)
FROM session_events
WHERE type='type3'
GROUP BY toYear(timestamp) LIMIT 10
병렬 레플리카 없이 쿼리 파이프라인을 살펴보겠습니다.
EXPLAIN PIPELINE graph = 1, compact = 0
SELECT count(), uniq(pageId) , min(timestamp), max(timestamp)
FROM session_events
WHERE type='type3'
GROUP BY toYear(timestamp)
LIMIT 10
SETTINGS allow_experimental_parallel_reading_from_replicas=0
FORMAT TSV;
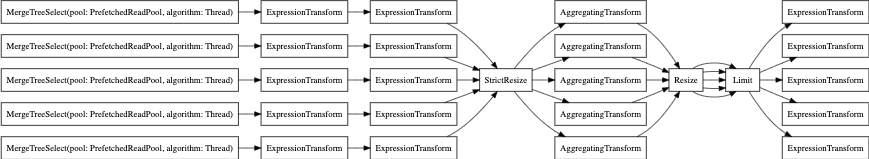
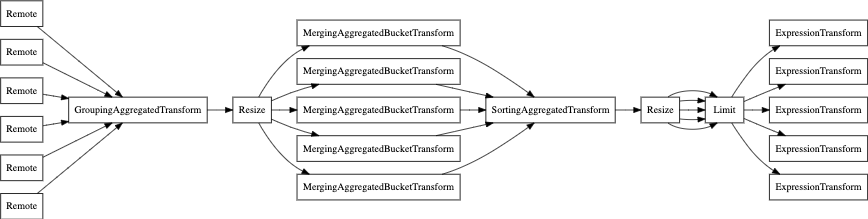
이제 parallel replicas(병렬 레플리카)를 사용하는 경우입니다.
EXPLAIN PIPELINE graph = 1, compact = 0
SELECT count(), uniq(pageId) , min(timestamp), max(timestamp)
FROM session_events
WHERE type='type3'
GROUP BY toYear(timestamp)
LIMIT 10
SETTINGS allow_experimental_parallel_reading_from_replicas=2
FORMAT TSV;