본문으로 바로가기
본문으로 바로가기

Prometheus 통합

이 기능은 Prometheus와 통합하여 ClickHouse Cloud 서비스를 모니터링할 수 있도록 지원합니다. Prometheus 메트릭에 대한 접근은 ClickHouse Cloud API 엔드포인트를 통해 제공되며, 이를 사용하여 Prometheus 메트릭 수집기로 메트릭을 안전하게 전송할 수 있습니다. 이러한 메트릭은 Grafana, Datadog 등의 대시보드와 통합하여 시각화할 수 있습니다.

시작하려면 API 키를 생성하십시오.

ClickHouse Cloud 메트릭 수집을 위한 Prometheus 엔드포인트 API

API reference

MethodPathDescription
GEThttps://api.clickhouse.cloud/v1/organizations/:organizationId/services/:serviceId/prometheus?filtered_metrics=[true | false]특정 서비스의 메트릭을 반환합니다
GEThttps://api.clickhouse.cloud/v1/organizations/:organizationId/prometheus?filtered_metrics=[true | false]조직 내 모든 서비스의 메트릭을 반환합니다

요청 매개변수

NameLocationType
Organization IDEndpoint addressuuid
Service IDEndpoint addressuuid (optional)
filtered_metricsQuery paramboolean (optional)

인증

기본 인증을 위해 ClickHouse Cloud API 키를 사용하십시오:

Username: <KEY_ID>
Password: <KEY_SECRET>
Example request
export KEY_SECRET=<key_secret>
export KEY_ID=<key_id>
export ORG_ID=<org_id>

# For all services in $ORG_ID
curl --silent --user $KEY_ID:$KEY_SECRET https://api.clickhouse.cloud/v1/organizations/$ORG_ID/prometheus?filtered_metrics=true

# For a single service only
export SERVICE_ID=<service_id>
curl --silent --user $KEY_ID:$KEY_SECRET https://api.clickhouse.cloud/v1/organizations/$ORG_ID/services/$SERVICE_ID/prometheus?filtered_metrics=true

샘플 응답

# HELP ClickHouse_ServiceInfo Information about service, including cluster status and ClickHouse version
# TYPE ClickHouse_ServiceInfo untyped
ClickHouse_ServiceInfo{clickhouse_org="c2ba4799-a76e-456f-a71a-b021b1fafe60",clickhouse_service="12f4a114-9746-4a75-9ce5-161ec3a73c4c",clickhouse_service_name="test service",clickhouse_cluster_status="running",clickhouse_version="24.5",scrape="full"} 1

# HELP ClickHouseProfileEvents_Query Number of queries to be interpreted and potentially executed. Does not include queries that failed to parse or were rejected due to AST size limits, quota limits or limits on the number of simultaneously running queries. May include internal queries initiated by ClickHouse itself. Does not count subqueries.
# TYPE ClickHouseProfileEvents_Query counter
ClickHouseProfileEvents_Query{clickhouse_org="c2ba4799-a76e-456f-a71a-b021b1fafe60",clickhouse_service="12f4a114-9746-4a75-9ce5-161ec3a73c4c",clickhouse_service_name="test service",hostname="c-cream-ma-20-server-3vd2ehh-0",instance="c-cream-ma-20-server-3vd2ehh-0",table="system.events"} 6

# HELP ClickHouseProfileEvents_QueriesWithSubqueries Count queries with all subqueries
# TYPE ClickHouseProfileEvents_QueriesWithSubqueries counter
ClickHouseProfileEvents_QueriesWithSubqueries{clickhouse_org="c2ba4799-a76e-456f-a71a-b021b1fafe60",clickhouse_service="12f4a114-9746-4a75-9ce5-161ec3a73c4c",clickhouse_service_name="test service",hostname="c-cream-ma-20-server-3vd2ehh-0",instance="c-cream-ma-20-server-3vd2ehh-0",table="system.events"} 230

# HELP ClickHouseProfileEvents_SelectQueriesWithSubqueries Count SELECT queries with all subqueries
# TYPE ClickHouseProfileEvents_SelectQueriesWithSubqueries counter
ClickHouseProfileEvents_SelectQueriesWithSubqueries{clickhouse_org="c2ba4799-a76e-456f-a71a-b021b1fafe60",clickhouse_service="12f4a114-9746-4a75-9ce5-161ec3a73c4c",clickhouse_service_name="test service",hostname="c-cream-ma-20-server-3vd2ehh-0",instance="c-cream-ma-20-server-3vd2ehh-0",table="system.events"} 224

# HELP ClickHouseProfileEvents_FileOpen Number of files opened.
# TYPE ClickHouseProfileEvents_FileOpen counter
ClickHouseProfileEvents_FileOpen{clickhouse_org="c2ba4799-a76e-456f-a71a-b021b1fafe60",clickhouse_service="12f4a114-9746-4a75-9ce5-161ec3a73c4c",clickhouse_service_name="test service",hostname="c-cream-ma-20-server-3vd2ehh-0",instance="c-cream-ma-20-server-3vd2ehh-0",table="system.events"} 4157

# HELP ClickHouseProfileEvents_Seek Number of times the 'lseek' function was called.
# TYPE ClickHouseProfileEvents_Seek counter
ClickHouseProfileEvents_Seek{clickhouse_org="c2ba4799-a76e-456f-a71a-b021b1fafe60",clickhouse_service="12f4a114-9746-4a75-9ce5-161ec3a73c4c",clickhouse_service_name="test service",hostname="c-cream-ma-20-server-3vd2ehh-0",instance="c-cream-ma-20-server-3vd2ehh-0",table="system.events"} 1840

# HELP ClickPipes_Info Always equal to 1. Label "clickpipe_state" contains the current state of the pipe: Stopped/Provisioning/Running/Paused/Failed
# TYPE ClickPipes_Info gauge
ClickPipes_Info{clickhouse_org="11dfa1ec-767d-43cb-bfad-618ce2aaf959",clickhouse_service="82b83b6a-5568-4a82-aa78-fed9239db83f",clickhouse_service_name="ClickPipes demo instace",clickpipe_id="642bb967-940b-459e-9f63-a2833f62ec44",clickpipe_name="Confluent demo pipe",clickpipe_source="confluent",clickpipe_status="Running"} 1

# HELP ClickPipes_SentEvents_Total Total number of records sent to ClickHouse
# TYPE ClickPipes_SentEvents_Total counter
ClickPipes_SentEvents_Total{clickhouse_org="11dfa1ec-767d-43cb-bfad-618ce2aaf959",clickhouse_service="82b83b6a-5568-4a82-aa78-fed9239db83f",clickhouse_service_name="ClickPipes demo instace",clickpipe_id="642bb967-940b-459e-9f63-a2833f62ec44",clickpipe_name="Confluent demo pipe",clickpipe_source="confluent"} 5534250

# HELP ClickPipes_SentBytesCompressed_Total Total compressed bytes sent to ClickHouse.
# TYPE ClickPipes_SentBytesCompressed_Total counter
ClickPipes_SentBytesCompressed_Total{clickhouse_org="11dfa1ec-767d-43cb-bfad-618ce2aaf959",clickhouse_service="82b83b6a-5568-4a82-aa78-fed9239db83f",clickhouse_service_name
="ClickPipes demo instace",clickpipe_id="642bb967-940b-459e-9f63-a2833f62ec44",clickpipe_name="Confluent demo pipe",clickpipe_source="confluent"} 380837520
ClickPipes_SentBytesCompressed_Total{clickhouse_org="11dfa1ec-767d-43cb-bfad-618ce2aaf959",clickhouse_service="82b83b6a-5568-4a82-aa78-fed9239db83f",clickhouse_service_name

# HELP ClickPipes_FetchedBytes_Total Total uncompressed bytes fetched from the source.
# TYPE ClickPipes_FetchedBytes_Total counter
ClickPipes_FetchedBytes_Total{clickhouse_org="11dfa1ec-767d-43cb-bfad-618ce2aaf959",clickhouse_service="82b83b6a-5568-4a82-aa78-fed9239db83f",clickhouse_service_name="ClickPipes demo instace",clickpipe_id="642bb967-940b-459e-9f63-a2833f62ec44",clickpipe_name="Confluent demo pipe",clickpipe_source="confluent"} 873286202

# HELP ClickPipes_Errors_Total Total errors ingesting data.
# TYPE ClickPipes_Errors_Total counter
ClickPipes_Errors_Total{clickhouse_org="11dfa1ec-767d-43cb-bfad-618ce2aaf959",clickhouse_service="82b83b6a-5568-4a82-aa78-fed9239db83f",clickhouse_service_name="ClickPipes demo instace",clickpipe_id="642bb967-940b-459e-9f63-a2833f62ec44",clickpipe_name="Confluent demo pipe",clickpipe_source="confluent"} 0

# HELP ClickPipes_SentBytes_Total Total uncompressed bytes sent to ClickHouse.
# TYPE ClickPipes_SentBytes_Total counter
ClickPipes_SentBytes_Total{clickhouse_org="11dfa1ec-767d-43cb-bfad-618ce2aaf959",clickhouse_service="82b83b6a-5568-4a82-aa78-fed9239db83f",clickhouse_service_name="ClickPipes demo instace",clickpipe_id="642bb967-940b-459e-9f63-a2833f62ec44",clickpipe_name="Confluent demo pipe",clickpipe_source="confluent"} 477187967

# HELP ClickPipes_FetchedBytesCompressed_Total Total compressed bytes fetched from the source. If data is uncompressed at the source, this will equal ClickPipes_FetchedBytes_Total
# TYPE ClickPipes_FetchedBytesCompressed_Total counter
ClickPipes_FetchedBytesCompressed_Total{clickhouse_org="11dfa1ec-767d-43cb-bfad-618ce2aaf959",clickhouse_service="82b83b6a-5568-4a82-aa78-fed9239db83f",clickhouse_service_name="ClickPipes demo instace",clickpipe_id="642bb967-940b-459e-9f63-a2833f62ec44",clickpipe_name="Confluent demo pipe",clickpipe_source="confluent"} 873286202

# HELP ClickPipes_FetchedEvents_Total Total number of records fetched from the source.
# TYPE ClickPipes_FetchedEvents_Total counter
ClickPipes_FetchedEvents_Total{clickhouse_org="11dfa1ec-767d-43cb-bfad-618ce2aaf959",clickhouse_service="82b83b6a-5568-4a82-aa78-fed9239db83f",clickhouse_service_name="ClickPipes demo instace",clickpipe_id="642bb967-940b-459e-9f63-a2833f62ec44",clickpipe_name="Confluent demo pipe",clickpipe_source="confluent"} 5535376

메트릭 레이블

모든 메트릭에는 다음 레이블이 있습니다.

LabelDescription
clickhouse_org조직 ID
clickhouse_service서비스 ID
clickhouse_service_name서비스 이름

ClickPipes 메트릭에는 다음 레이블도 포함됩니다.

LabelDescription
clickpipe_idClickPipe ID
clickpipe_nameClickPipe 이름
clickpipe_sourceClickPipe 소스 유형

정보 메트릭

ClickHouse Cloud는 항상 값이 1gauge 타입의 특수 메트릭 ClickHouse_ServiceInfo를 제공합니다. 이 메트릭에는 모든 Metric Labels와 함께 다음 레이블이 포함됩니다.

LabelDescription
clickhouse_cluster_status서비스의 상태입니다. 다음 중 하나일 수 있습니다: [awaking | running | degraded | idle | stopped]
clickhouse_version서비스가 실행 중인 ClickHouse 서버의 버전입니다.
scrape마지막 스크레이프의 상태를 나타냅니다. full 또는 partial일 수 있습니다.
full마지막 메트릭 스크레이프 동안 오류가 없었음을 나타냅니다.
partial마지막 메트릭 스크레이프 동안 일부 오류가 있었으며 ClickHouse_ServiceInfo 메트릭만 반환되었음을 나타냅니다.

메트릭을 조회하는 요청은 idle 상태의 서비스를 다시 활성화하지 않습니다. 서비스가 idle 상태인 경우 ClickHouse_ServiceInfo 메트릭만 반환됩니다.

ClickPipes의 경우, Metric Labels와 함께 다음 레이블을 포함하는 유사한 gauge 타입 메트릭 ClickPipes_Info가 있습니다.

LabelDescription
clickpipe_state파이프의 현재 상태입니다.

Prometheus 구성

Prometheus 서버는 설정된 대상에서 지정된 간격으로 메트릭을 수집합니다. 아래는 Prometheus 서버에서 ClickHouse Cloud Prometheus Endpoint를 사용하기 위한 예시 구성입니다.

global:
  scrape_interval: 15s

scrape_configs:
  - job_name: "prometheus"
    static_configs:
    - targets: ["localhost:9090"]
  - job_name: "clickhouse"
    static_configs:
      - targets: ["api.clickhouse.cloud"]
    scheme: https
    params:
      filtered_metrics: ["true"]
    metrics_path: "/v1/organizations/<ORG_ID>/prometheus"
    basic_auth:
      username: <KEY_ID>
      password: <KEY_SECRET>
    honor_labels: true

인스턴스 라벨이 올바르게 채워지도록 honor_labels 설정 매개변수를 true로 설정해야 합니다. 또한 위 예시에서는 filtered_metricstrue로 설정되어 있지만, 이는 사용자 선호에 따라 설정하면 됩니다.

Grafana와 통합하기

Grafana와 통합하는 주요 방법은 두 가지가 있습니다.

  • Metrics Endpoint – 이 방식은 추가 구성 요소나 인프라가 필요 없다는 장점이 있습니다. 이 방법은 Grafana Cloud에서만 사용할 수 있으며, ClickHouse Cloud Prometheus Endpoint URL과 자격 증명만 있으면 됩니다.
  • Grafana Alloy - Grafana Alloy는 OpenTelemetry (OTel) Collector의 벤더 중립 배포판으로, 기존 Grafana Agent를 대체합니다. 스크레이퍼(scraper)로 사용할 수 있고, 자체 인프라에 배포할 수 있으며, 모든 Prometheus Endpoint와 호환됩니다.

아래에서는 이러한 옵션을 사용하는 방법을 안내하며, 특히 ClickHouse Cloud Prometheus Endpoint와 관련된 세부 사항에 중점을 둡니다.

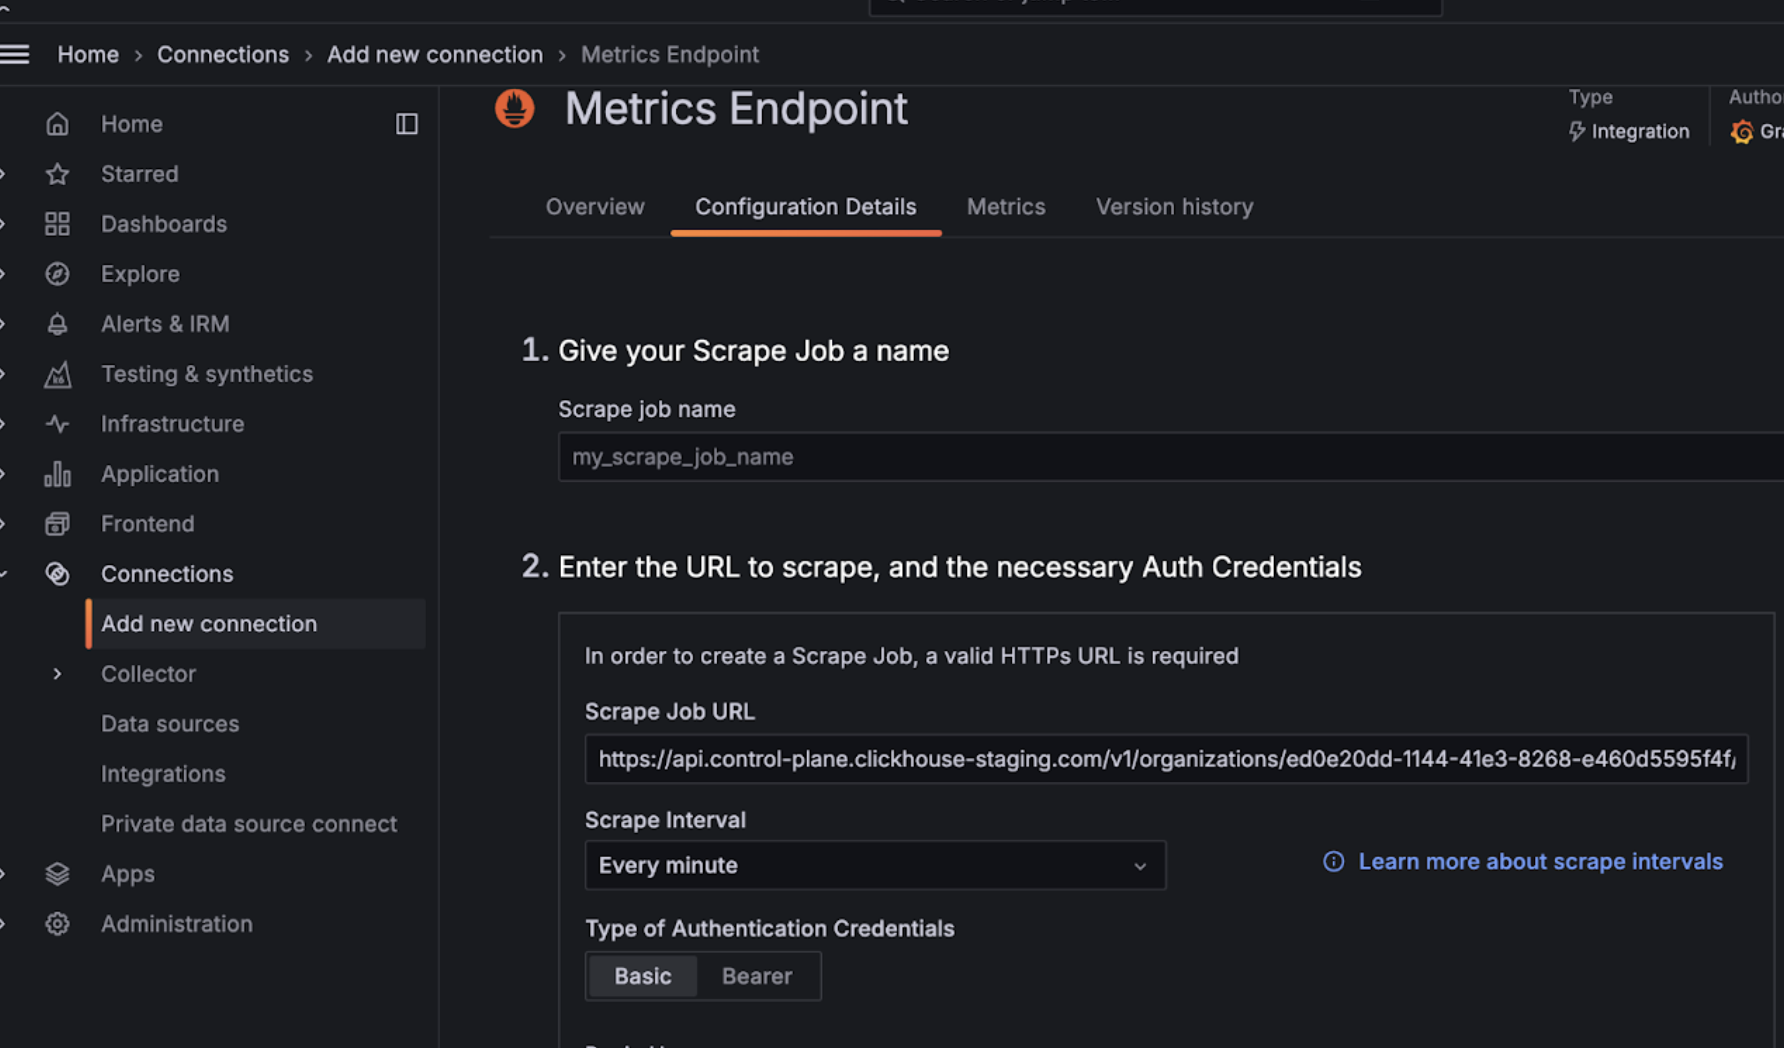
Grafana Cloud with metrics endpoint

  • Grafana Cloud 계정에 로그인합니다.
  • Metrics Endpoint를 선택하여 새 연결을 추가합니다.
  • Scrape URL을 Prometheus endpoint로 지정하고 기본 인증(basic auth)을 사용하여 API 키/시크릿으로 연결을 구성합니다.
  • 연결 테스트를 실행하여 정상적으로 연결되는지 확인합니다.
Grafana Metrics Endpoint 구성

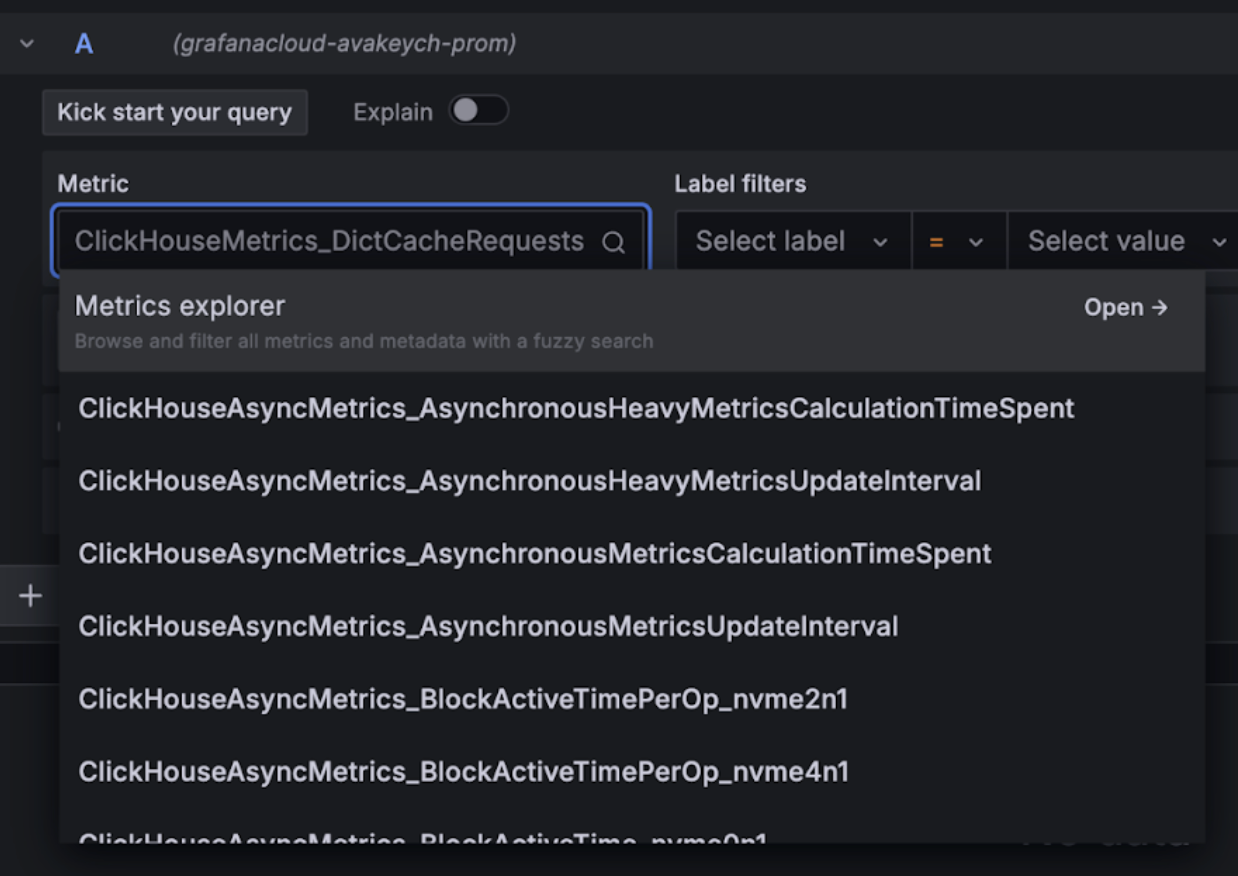
구성이 완료되면, 대시보드를 구성할 때 선택할 수 있는 메트릭이 드롭다운 목록에 표시됩니다:

Grafana Metrics Explorer 드롭다운

Grafana Metrics Explorer 차트

Alloy와 함께 사용하는 Grafana Cloud

Grafana Cloud를 사용하는 경우, Grafana에서 Alloy 메뉴로 이동한 후 화면에 표시되는 안내를 따르면 Alloy를 설치할 수 있습니다.

Grafana Alloy

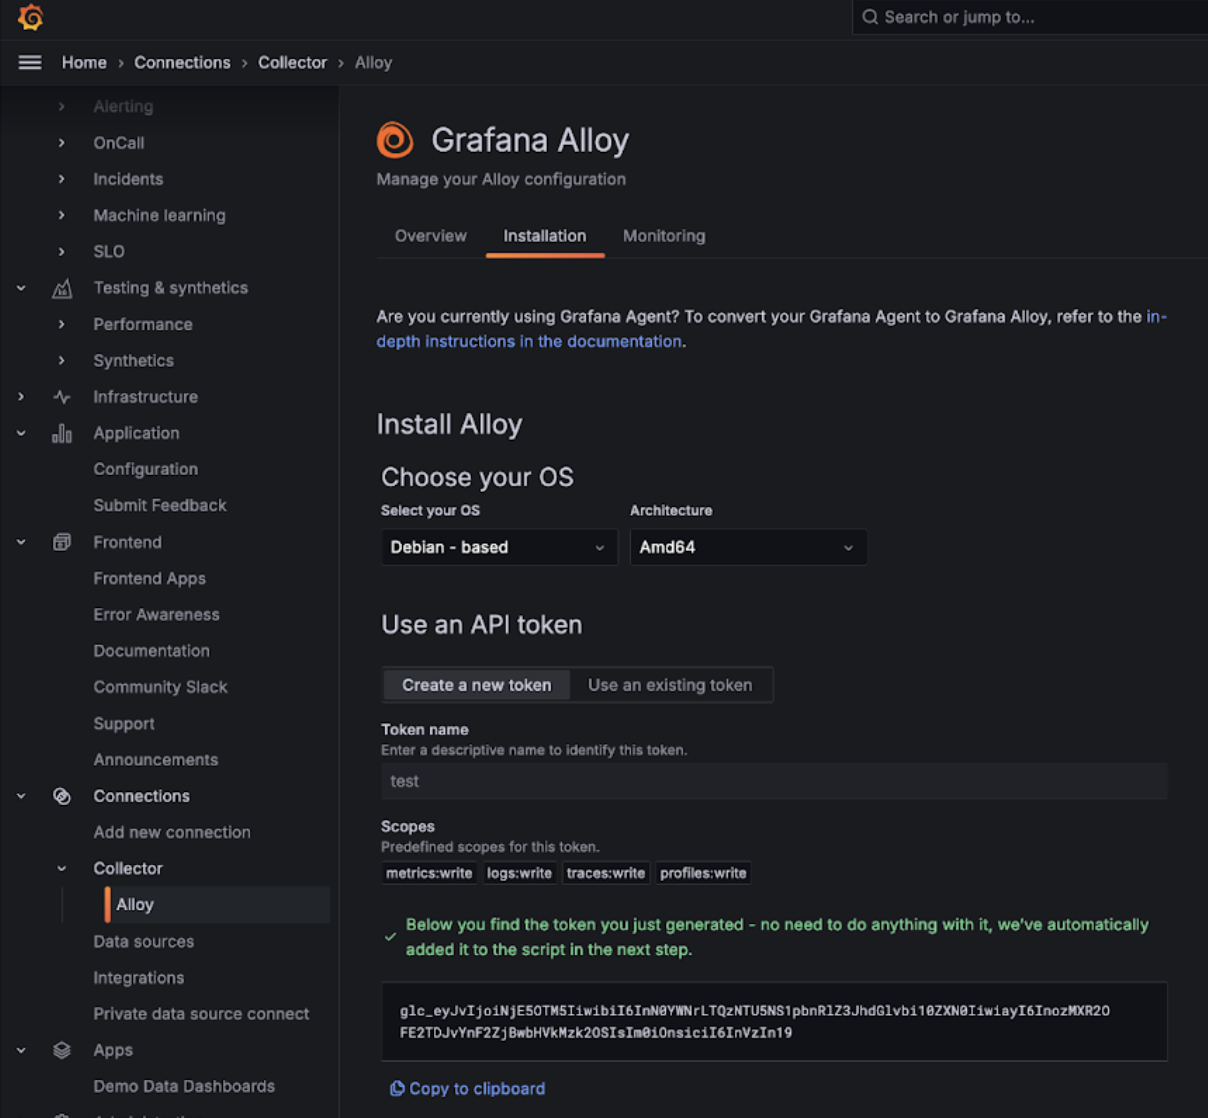
이렇게 하면 인증 토큰을 사용하여 데이터를 Grafana Cloud 엔드포인트로 전송하는 prometheus.remote_write 컴포넌트가 포함된 Alloy가 구성됩니다. 이후에는 Linux에서는 /etc/alloy/config.alloy에 있는 Alloy 설정을 수정하여 ClickHouse Cloud Prometheus Endpoint를 스크레이핑하는 스크레이퍼(scraper)를 포함하도록 하기만 하면 됩니다.

다음은 ClickHouse Cloud Endpoint에서 메트릭을 수집하는 prometheus.scrape 컴포넌트와, 자동으로 구성된 prometheus.remote_write 컴포넌트가 포함된 Alloy 설정 예시입니다. basic_auth 설정 컴포넌트에는 Cloud API 키 ID와 시크릿이 각각 사용자 이름과 비밀번호로 설정된다는 점에 유의하십시오.

prometheus.scrape "clickhouse_cloud" {
  // Collect metrics from the default listen address.
  targets = [{
        __address__ = "https://api.clickhouse.cloud/v1/organizations/:organizationId/prometheus?filtered_metrics=true",
// e.g. https://api.clickhouse.cloud/v1/organizations/97a33bdb-4db3-4067-b14f-ce40f621aae1/prometheus?filtered_metrics=true
  }]

  honor_labels = true

  basic_auth {
        username = "KEY_ID"
        password = "KEY_SECRET"
  }

  forward_to = [prometheus.remote_write.metrics_service.receiver]
  // forward to metrics_service below
}

prometheus.remote_write "metrics_service" {
  endpoint {
        url = "https://prometheus-prod-10-prod-us-central-0.grafana.net/api/prom/push"
        basic_auth {
          username = "<Grafana API username>"
          password = "<grafana API token>"
    }
  }
}

honor_labels 구성 매개변수는 인스턴스 레이블이 올바르게 설정되도록 true로 지정해야 합니다.

Grafana 자가 관리형 환경에서 Alloy 사용

Grafana를 자가 관리형으로 운영하는 사용자는 Alloy 에이전트 설치 방법을 여기에서 확인할 수 있습니다. Alloy가 Prometheus 메트릭을 원하는 대상으로 전송하도록 이미 구성되어 있다고 가정합니다. 아래의 prometheus.scrape 컴포넌트는 Alloy가 ClickHouse Cloud Endpoint에서 메트릭을 수집하도록 합니다. 또한 prometheus.remote_write가 수집된 메트릭을 수신한다고 가정합니다. 이 구성이 존재하지 않는 경우 대상에 맞게 forward_to key를 조정하십시오.

prometheus.scrape "clickhouse_cloud" {
  // Collect metrics from the default listen address.
  targets = [{
        __address__ = "https://api.clickhouse.cloud/v1/organizations/:organizationId/prometheus?filtered_metrics=true",
// e.g. https://api.clickhouse.cloud/v1/organizations/97a33bdb-4db3-4067-b14f-ce40f621aae1/prometheus?filtered_metrics=true
  }]

  honor_labels = true

  basic_auth {
        username = "KEY_ID"
        password = "KEY_SECRET"
  }

  forward_to = [prometheus.remote_write.metrics_service.receiver]
  // forward to metrics_service. Modify to your preferred receiver
}

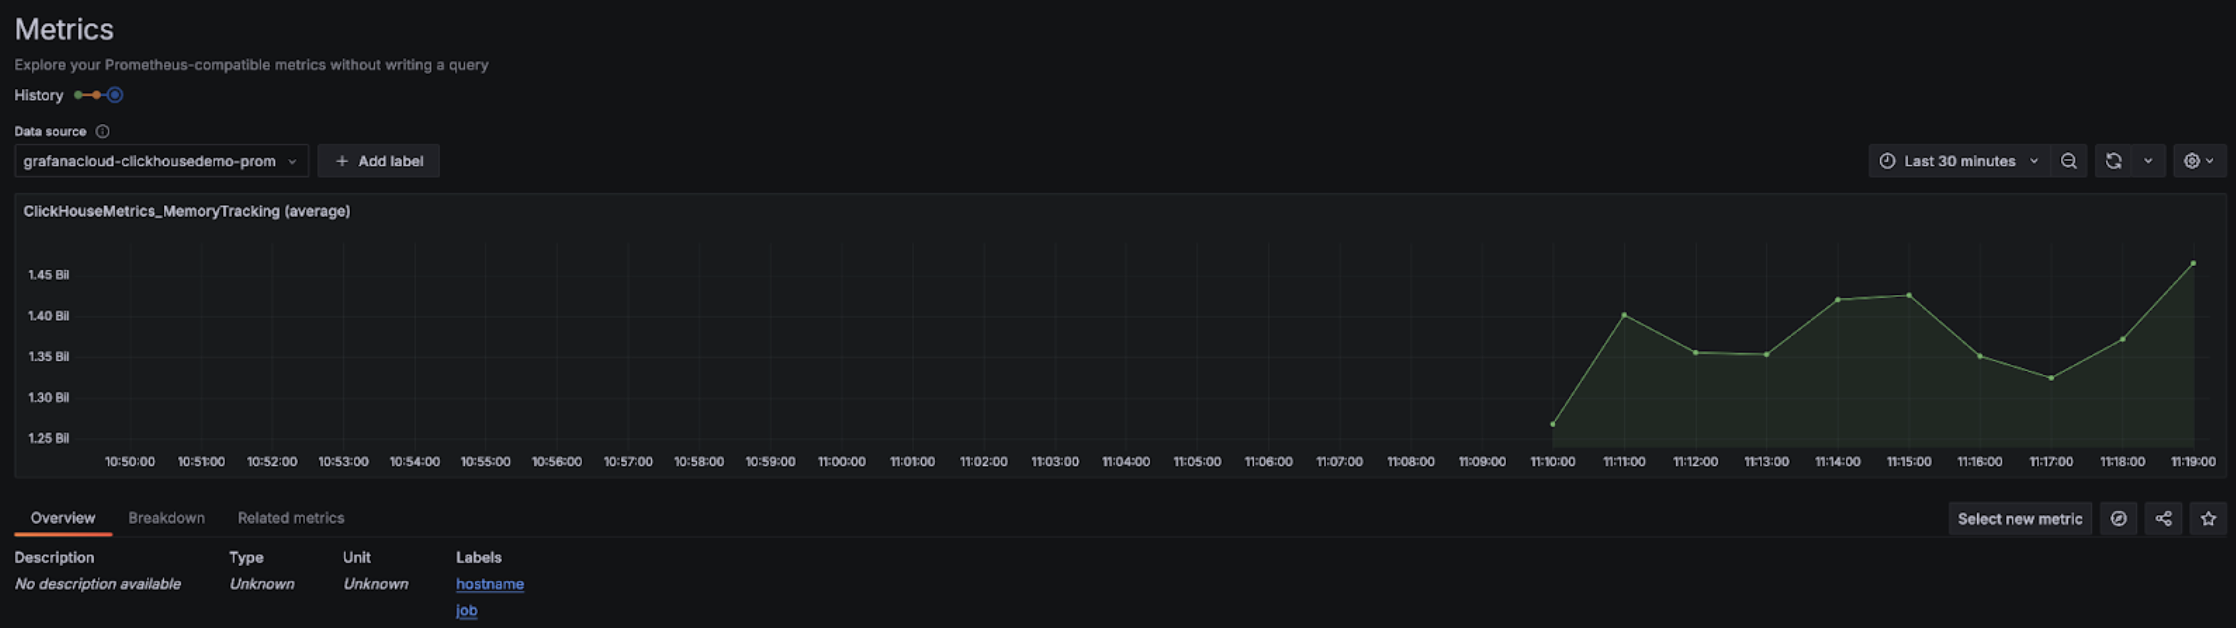
구성이 완료되면 metrics explorer에서 ClickHouse 관련 메트릭을 확인할 수 있어야 합니다:

Grafana Metrics Explorer

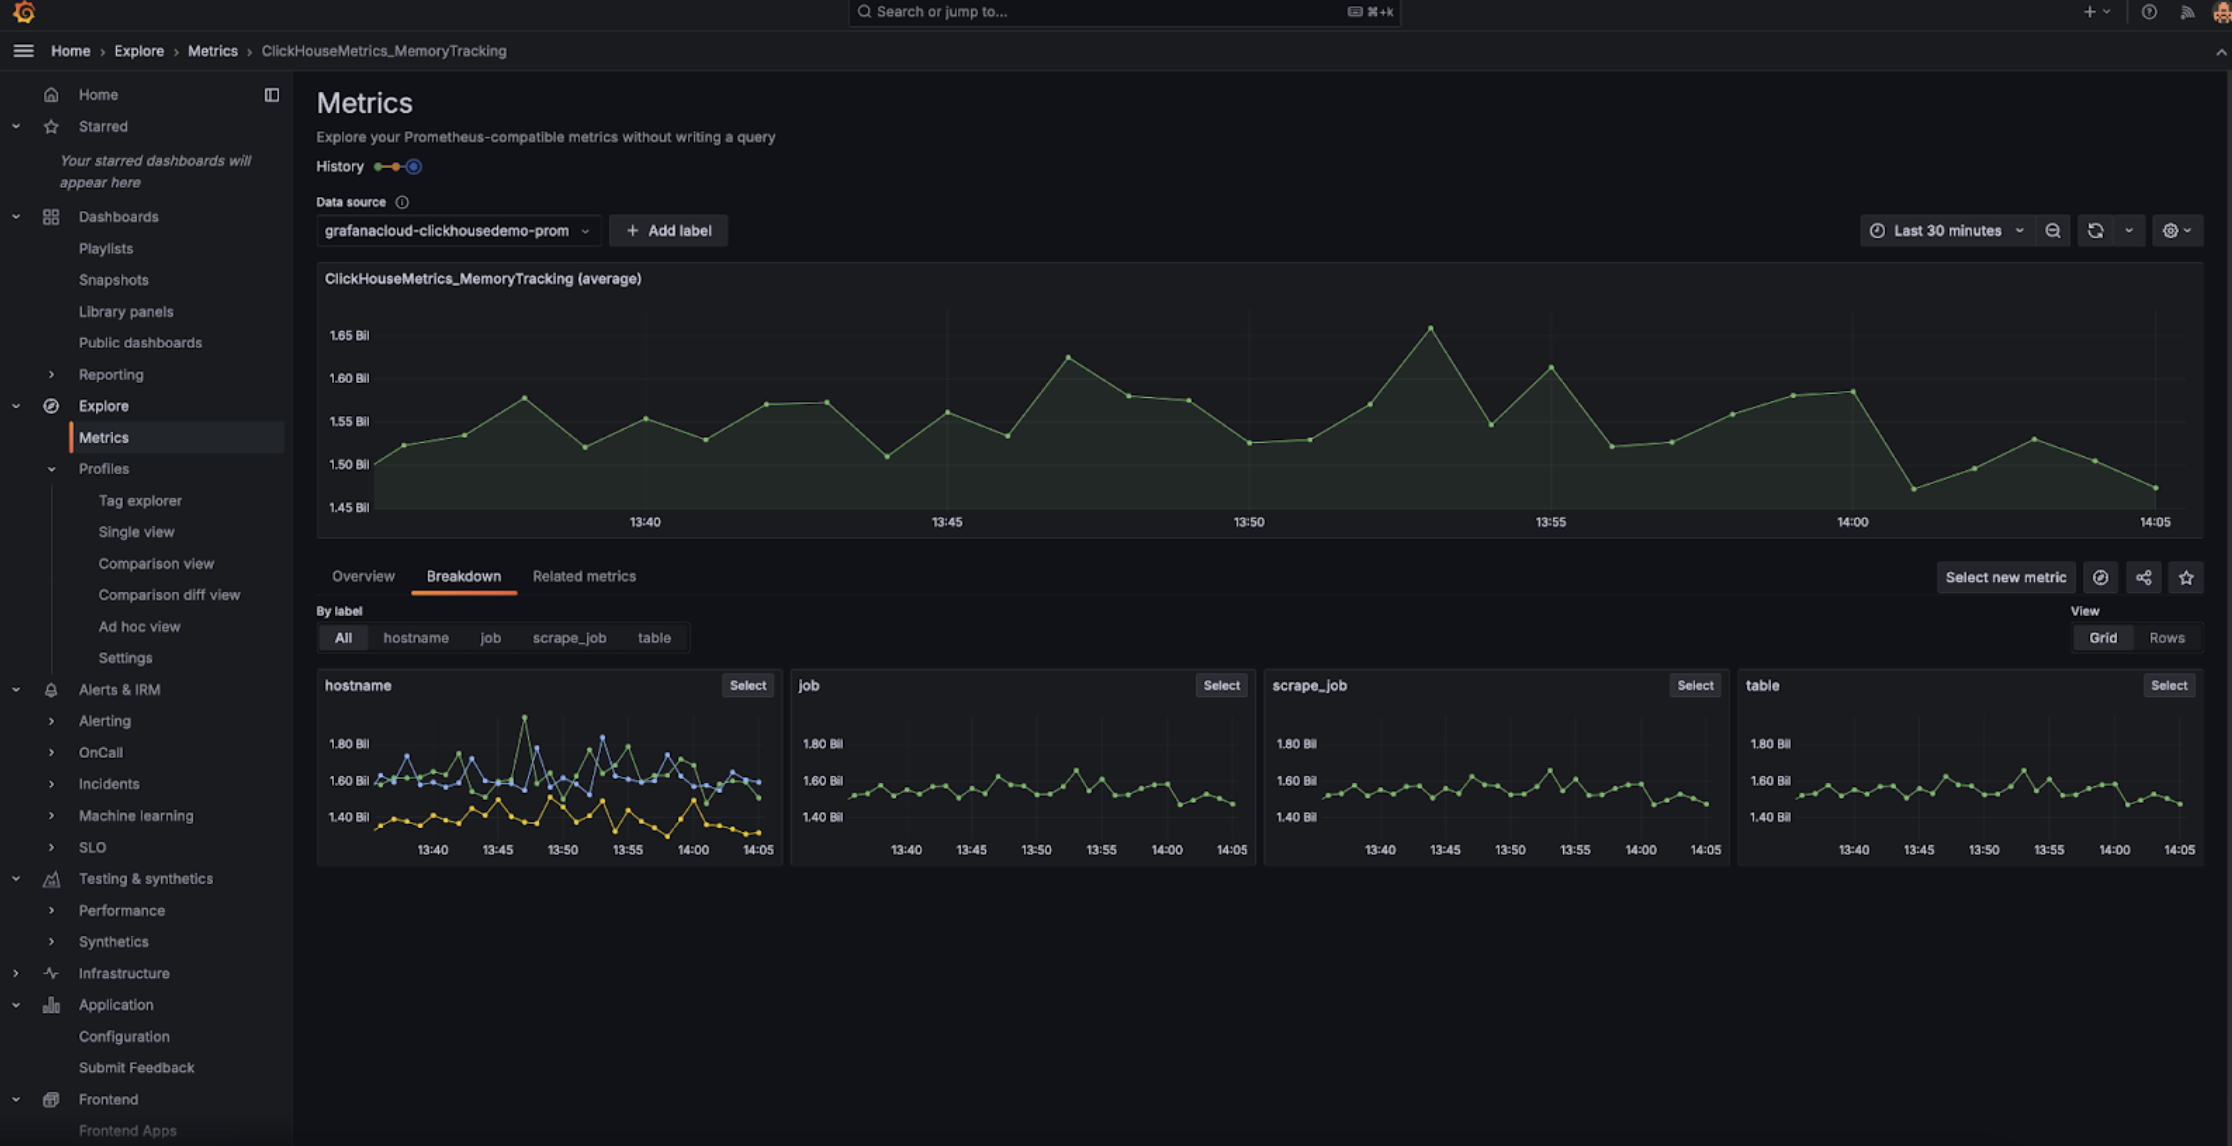
인스턴스 레이블이 올바르게 표시되도록 honor_labels 설정 파라미터를 true로 설정해야 합니다.
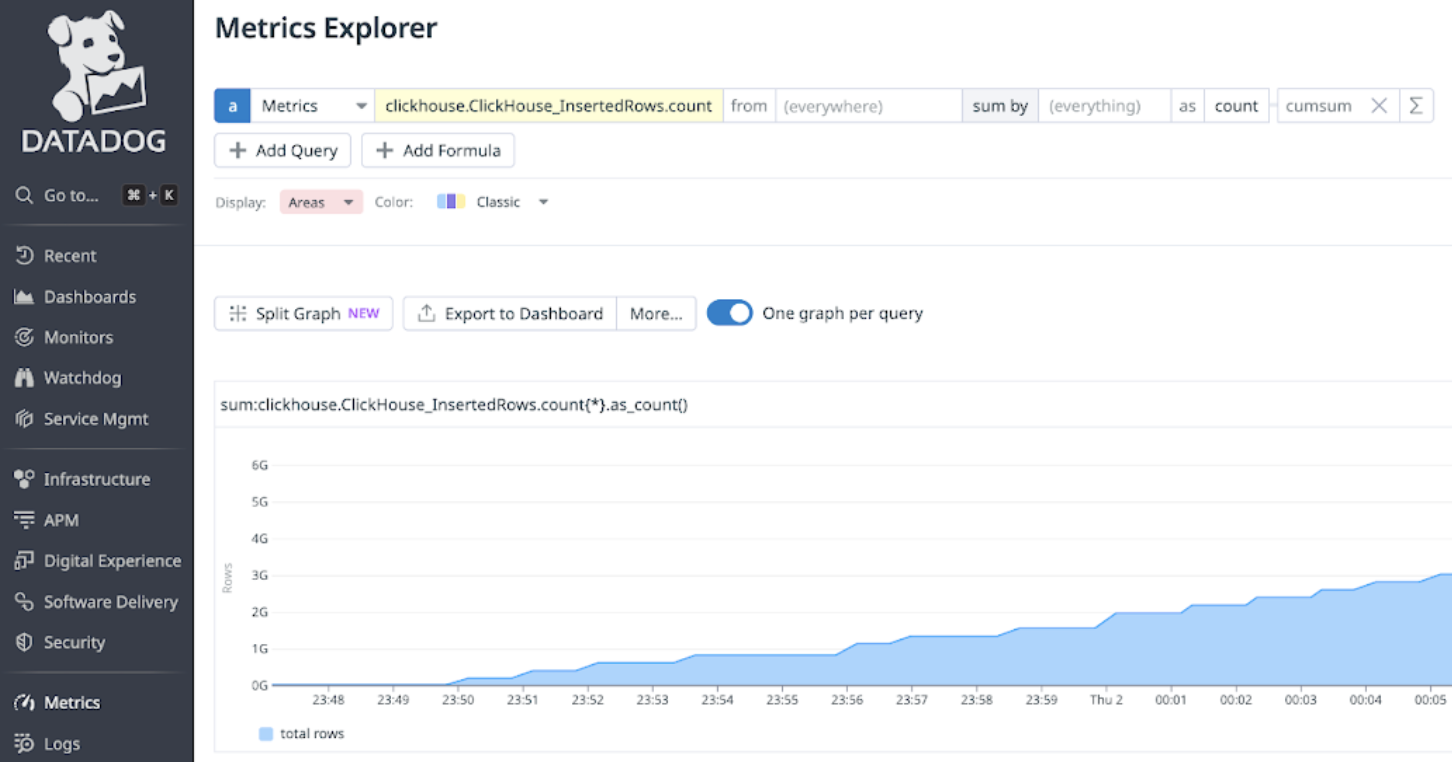
Datadog과 통합

Datadog AgentOpenMetrics integration을 사용하여 ClickHouse Cloud 엔드포인트에서 메트릭을 수집할 수 있습니다. 아래는 이 Agent와 통합을 위한 간단한 예제 구성입니다. 다만, 실제 환경에서는 중요한 메트릭만 선택하여 수집하도록 설정하는 것이 좋습니다. 아래의 포괄적인 예제는 수천 개에 달하는 메트릭-인스턴스 조합을 내보내며, Datadog에서는 이를 커스텀 메트릭으로 간주합니다.

init_config:

instances:
   - openmetrics_endpoint: 'https://api.clickhouse.cloud/v1/organizations/97a33bdb-4db3-4067-b14f-ce40f621aae1/prometheus?filtered_metrics=true'
     namespace: 'clickhouse'
     metrics:
         - '^ClickHouse.*'
     username: username
     password: password

Prometheus와 Datadog 통합